Lesson 4: Data filtering
Preparation
If not the case yet, load the demo dataset and start the 'Trends and Distributions' Cockpit, as described in the beginning of lesson 01.
Data filters allow you to selectively hide parts of the data from all visualizations and calculations in the cockpit. In contrast to the data selection (focus), where entries which are not selected are still displayed as gray context, filtered entries no longer appear in the visualizations.
Filtering unwanted parts of the data out
One usecase of filtering is to exclude unwanted parts, like selected outliers via the filter to have the full display resolution available for plausible data.
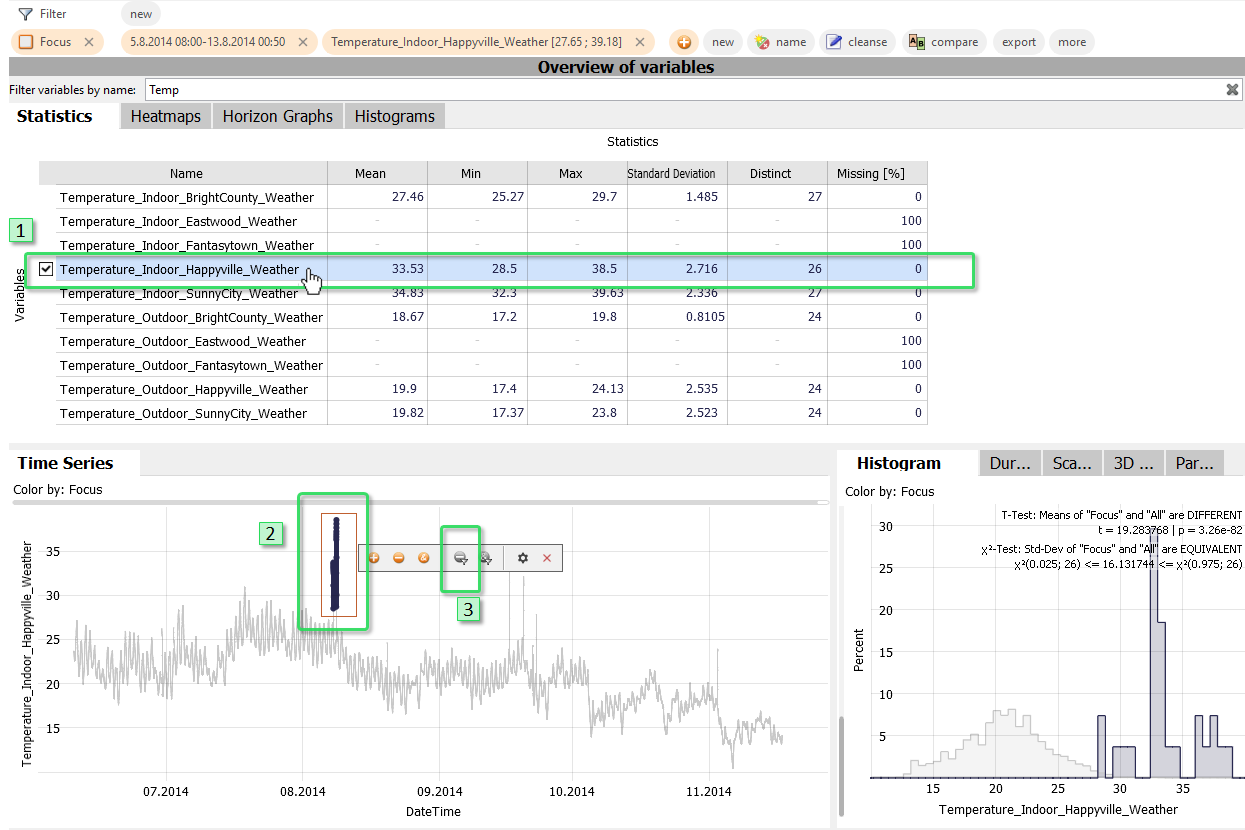
Select the time series "Temperature_Indoor_Happyville_Weather" in an overview (left click on the name in an overview like "Statistics"). Clear the focus (DELETE key), if any, and make sure the "Time Series" view is zoomed out (button in lower left corner).
Then, select a spike in the "Time Series" view by dragging a rectangle with the left mouse button. (Remember, the selection tool can be chosen by clicking on the view title "Time Series", then "Selection mode").
Now press the small gray icon of the filter with the minus symbol, appearing next to the selection rectangle to filter these records out:
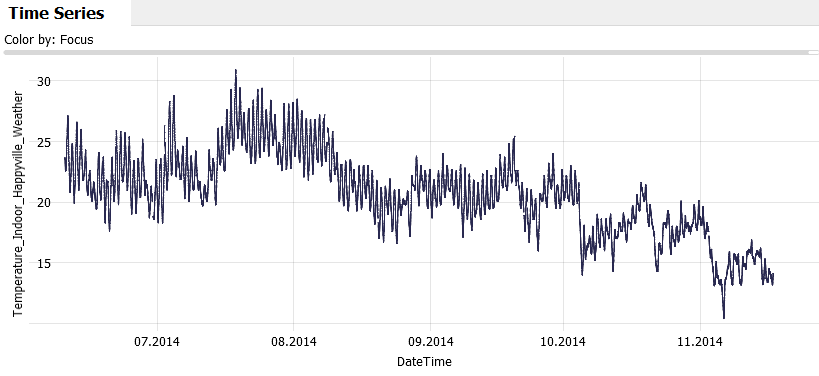
You can repeat this selecting / filtering for any other spikes and outliers you would like to remove. Zooming in helps for selecting precisely what you want. After filtering all the spikes out, it should look like this:
Caution: Filtering always removes entire data records (= table rows) from the data table. This means that removing those spikes has also removed possibly useful values from the other time series at these points in time. If you want to edit values only for the selected time series, while keeping the other time series intact, use the "cleanse" action in the focus bar after selecting the values .
Let's clear the filter again. Press the small "x" symbol next to the word "Filter" in the filter bar at the top of Visplore, and the records with the temperature spikes are back.
Filter to limit the analysis to a relevant subset of the data
Another important usecase of filtering is limiting the analysis to a subset of the data records, like some categories, or time periods, and disregarding the rest. There are multiple ways to achieve this:
Specify filters by hand, like in Excel
One option is using a control element to choose which categories, time periods, or value intervals to keep.
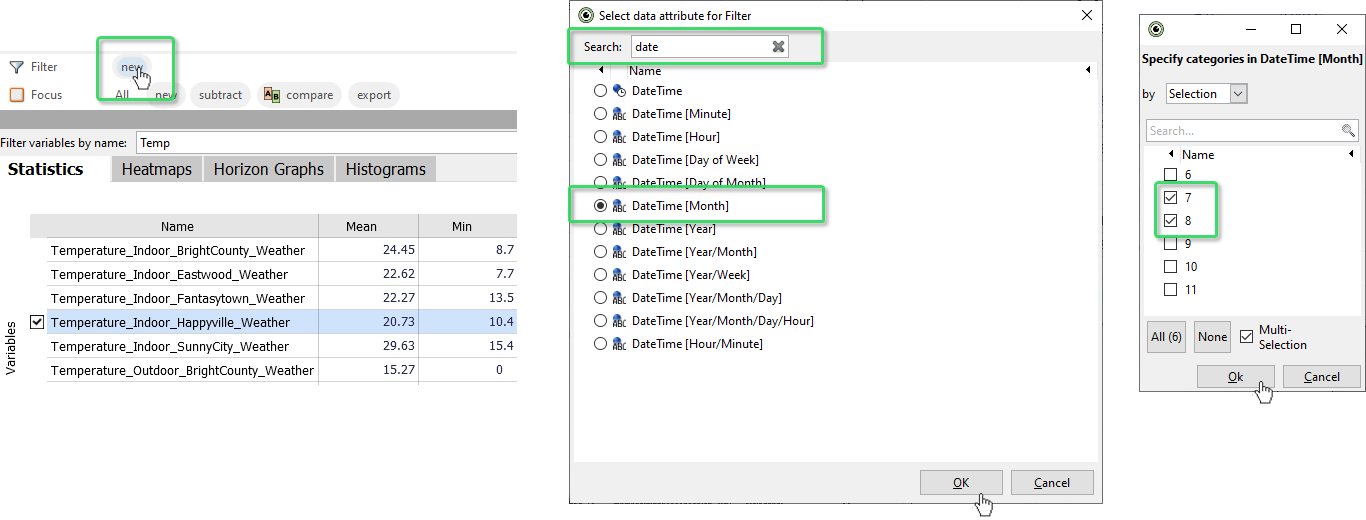
Press the "new" button of the filter bar on top of Visplore, then type "date" to filter the list, and select the data attribute "DateTime [Month]". Press ok. Next, mark the checkboxes of the months 7 and 8, to keep just July and August. You immediately see the effect on the whole cockpit. Press OK to confirm.
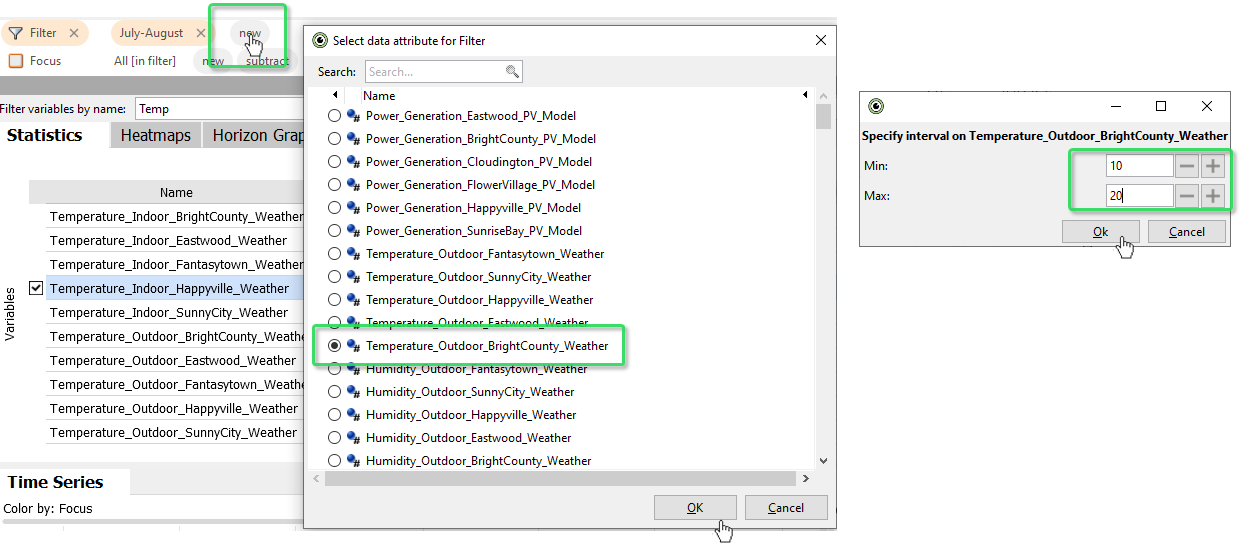
Now modify the filter by clicking on its orange representation "July-August" in the filter bar. There, select September as an additional month and close the dialog by pressing the red X.

Use the "new" button in the filter bar, to refine the filter further. Choose the time series "Temperature_Outdoor_BrightCounty_Weather", then specify the interval 10 to 20 (degrees) to keep. Select the time series "Temperature_Outdoor_BrightCounty_Weather" in an overview, to look at it. Now only times are analyzed, where the temperature sensor was in that interval, between July and September.
Specify filters by interactive data selection
Alternatively, any current definition of the focus can be used to refine the filter.
Drag a rectangle with the left mouse button in the "Time Series" view to select some of the records. Then, click the "Focus" button in the focus bar, then choose "Filter: keep only selected data":
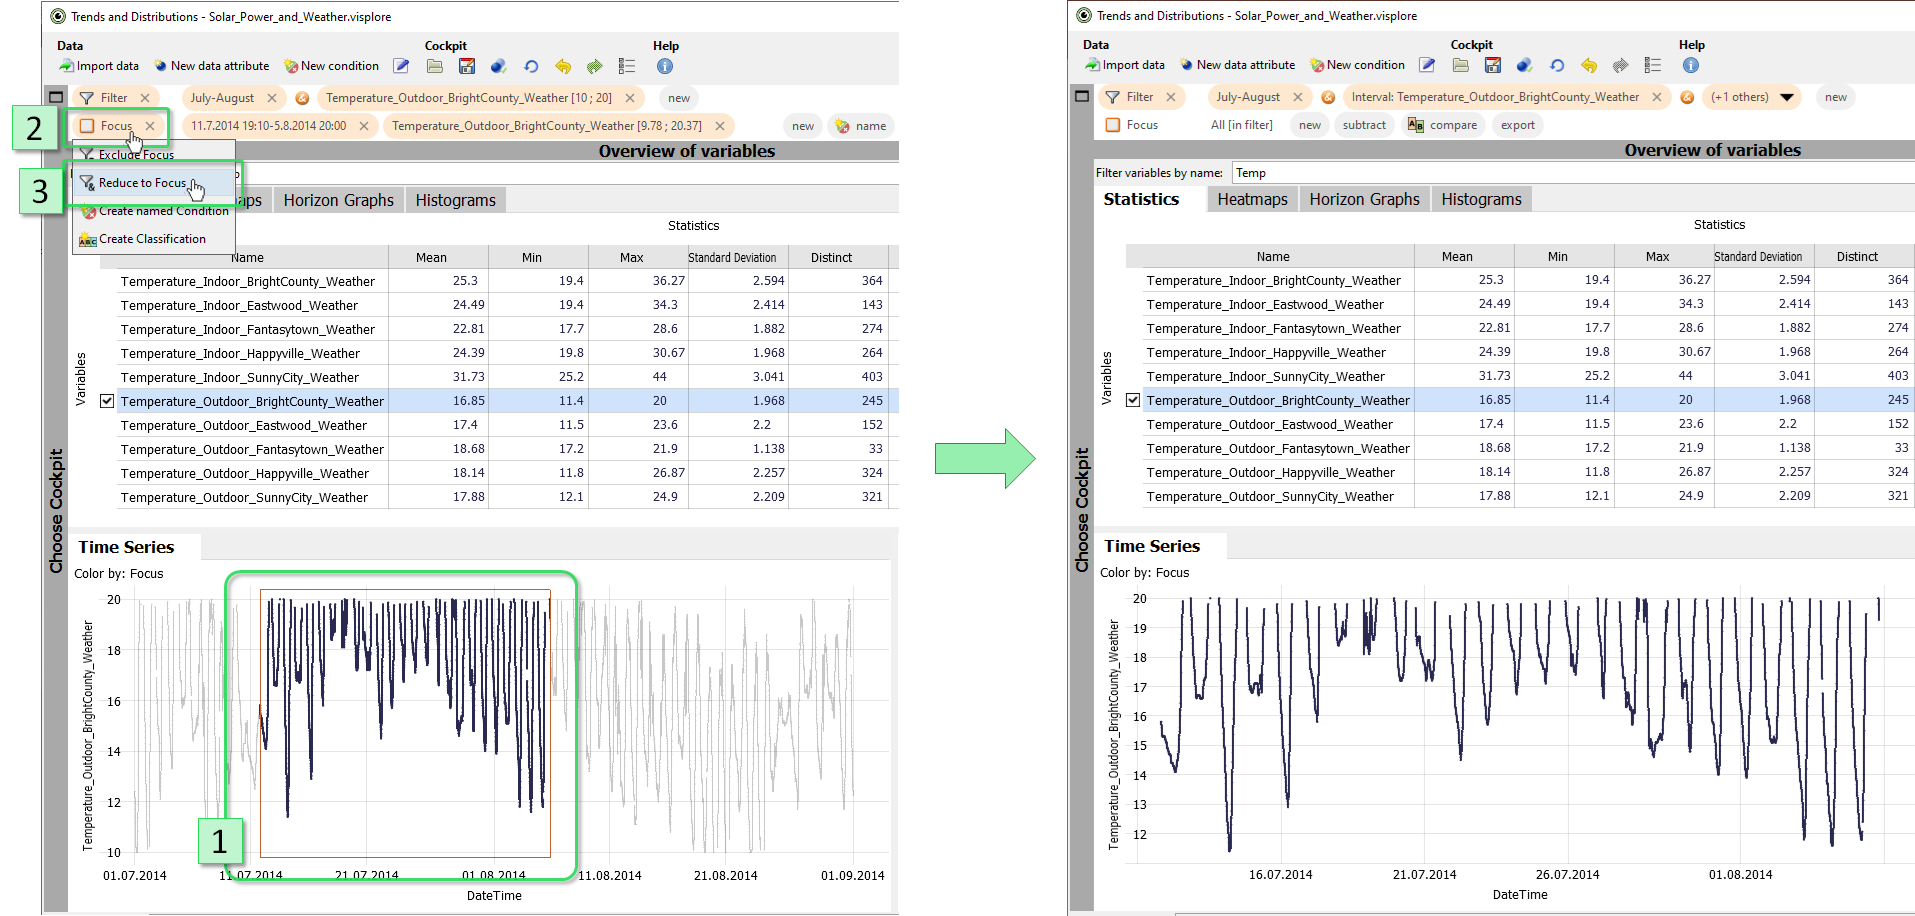
This has added the focus as an additional part to the filter bar, reducing the kept data records further.
Any of these filter parts can be modified in retrospect by clicking on their orange representation, or removed by pressing the small "x" on their right.
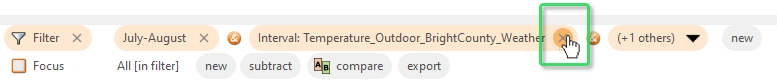
Remove the middle part, e.g., the temperature interval by pressing its small "x":
Well done! You have mastered the basics of filtering data records in Visplore! :)
>> Continue with Lesson 5: Switch cockpits (Example: Correlations)
License Statement for the Photovoltaic and Weather dataset used for Screenshots:
"Contains public sector information licensed under the Open Government Licence v3.0."
Source of Dataset (in its original form): https://data.london.gov.uk/dataset/photovoltaic--pv--solar-panel-energy-generation-data
License: UK Open Government Licence OGL 3: http://www.nationalarchives.gov.uk/doc/open-government-licence/version/3/
Dataset was modified (e.g. columns renamed) for easier communication of Visplore USPs.