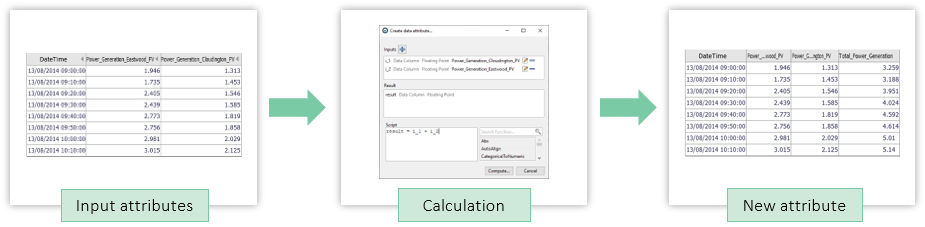
Computing new data attributes
During validating and preparing your data you might find that you need to modify your variables (such as creating totals or adjusting the range). Furthermore, you might find during exploration that the calculation of a KPI is of value or that you want to apply other transformations (such as time alignment or moving averages). Lastly, you might find that more sophisticated enrichments such as numbering cycles or dynamic value expectations are necessary.
All these computations can be generated dynamically from within Visplore. A formula editor supports everything from typing simple arithmetic formulas, to powerful Python 3 scripts. Optionally, there are several built-in formula blocks ready to use.
Preparation (to follow this lesson using demo data)
For the tutorial, load the solar power demo dataset from the welcome dialog, as shown below. Note: In Visplore Discovery/Professional, you need to click "Demo Data", and then "Solar Power"

Create a new numerical time series
As a simple example we create a new numerical time series that contains derived values from another time series (inverted in this case).
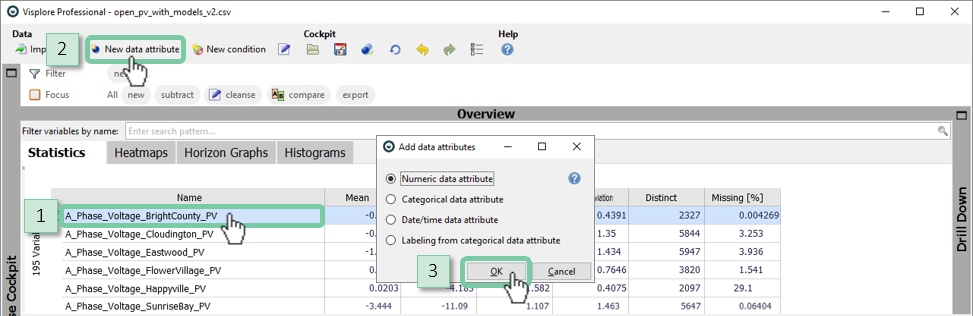
1. Select the first time series "A_Phase_Voltage_BrightCounty_PV" in the "Statistics" view by clicking its name. This will be the input to the newly computed time series.
2. Then, click "New data attribute" in the toolbar.
3. Select "Define numeric data attribute" from the dialog. Alternatively, a categorical attribute can be created using the same workflow, which you can try out later. Press "OK".
|
The next dialog is the formula editor. These are the most important elements:
|
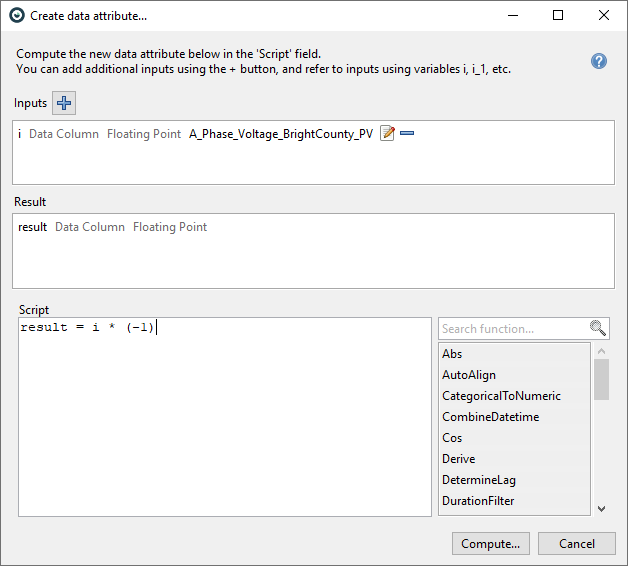 |
Our first computation is to invert the sign of the values. In other words, multiplying the values by -1. Click in the "Script" field, and type: result = i * (-1)
Click "Compute" and then "OK"
The next dialog is for naming the new attribute. For now, accept the suggested name, and press "OK".
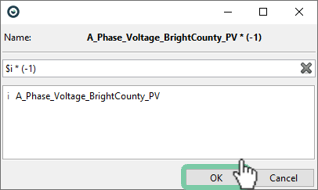
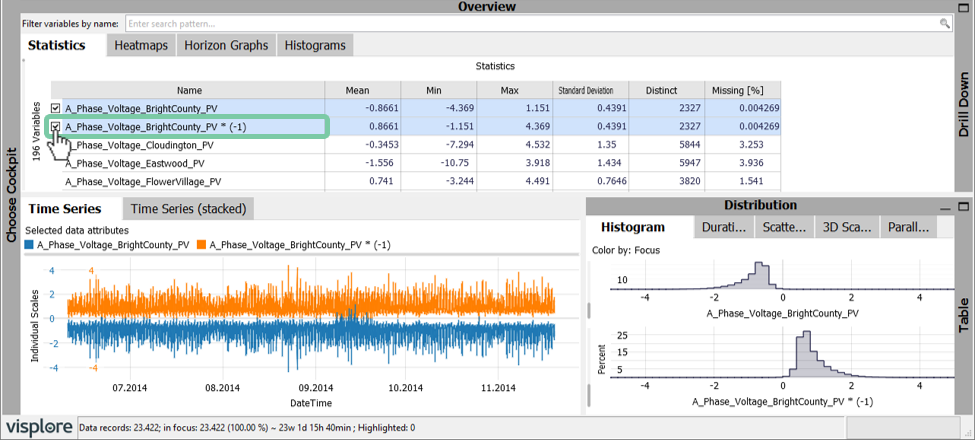
The cockpit updates. You see how the new attribute "A_Phase_Voltage_BrightCounty_PV * (-1)" has appeared in the list.
Use the checkmark to select "A_Phase_Voltage_BrightCounty_PV * (-1)" in the "Statistics" view. Now, you see the new and the original time series at the same time:
Compute the sum of two inputs
Our next data attribute will be computing the point-wise sum of two time series.
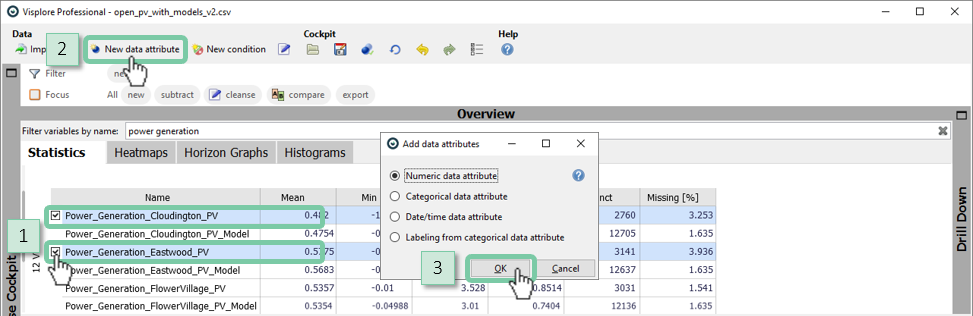
1. Select "Power_Generation_Cloudington_PV" and "Power_Generation_Eastwood_PV" in the "Statistics" view as shown below.
2. Then again, click "New data attribute"
3. Click "Define numeric data attribute".
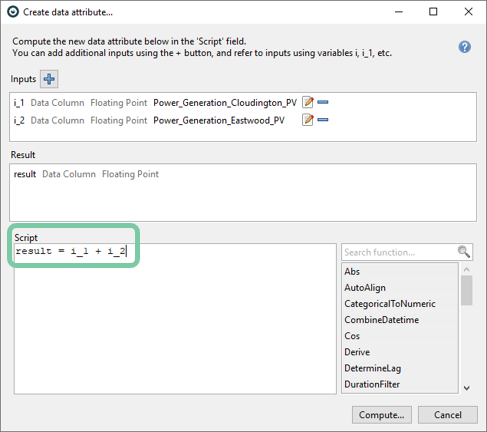
In the dialog, click in the "Script" field and type: result = i_1 + i_2. Confirm by pressing "Compute" and "OK", and "OK" in the naming dialog.
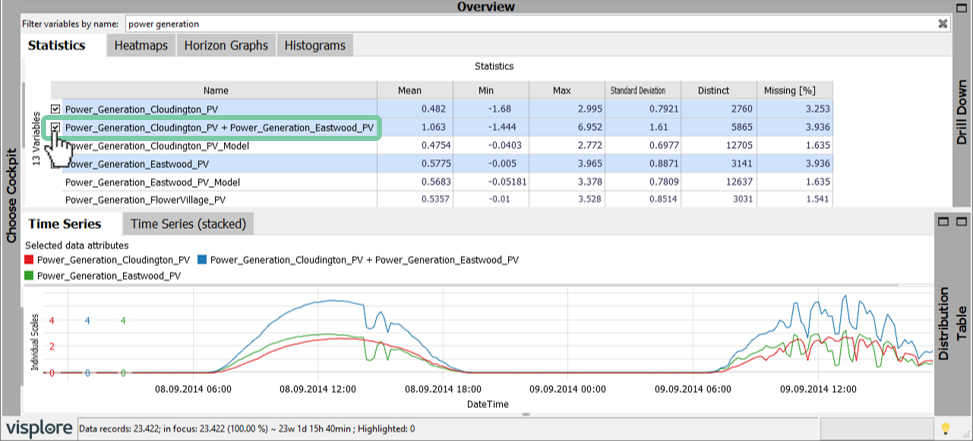
The cockpit updates. When you select the new attribute "Power_Generation_Cloudington_PV + Power_Generation_Eastwood_PV" as third time series, and zoom in a bit (drag right mouse button), Visplore looks like this:
Editing a computation afterwards
You can change the script of a computed data attribute later on. For example, if you discover you made a mistake in the formula, or you want to tweak some parameters based on what you saw in the visualization.
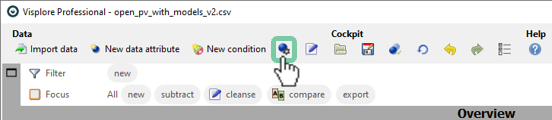
Make sure, the computed attribute "Power_Generation_Cloudington_PV + Power_Generation_Eastwood_PV" is selected in the "Statistics" view, then press the blue icon with the gearwheel in the toolbar:
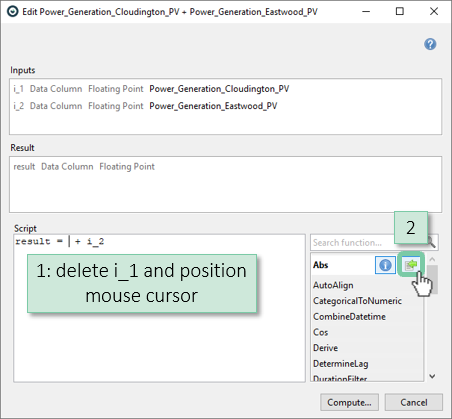
Now say we want to change the script, as to use the absolute value of the variables before summing them up. For this, we can use one of the built-in formula parts offered at the right side of the dialog:
In the "Script" field, delete i_1 from the formula as to look like the image below. Then, hover the word "Abs" in the list of formula parts on the right, and press the right icon with the green arrow, to insert the formula part for taking absolute values.
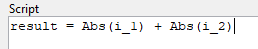
Do the same to take absolutes of i_2 in the script as well. You may have to adjust the script by hand, as the built-in formula editor always writes i_1. It should look like this:
Press "Compute" to validate the correctness of the script.
Whenever you edit the script, and press "Compute", the visualizations immediately update with the new values. With this, experimenting with the script and tweaking parameters becomes very efficient.
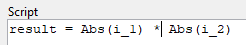
Try out another change: simply replace the + in the formula by typing a * instead, to perform multiplication instead of summation. When pressing "Compute", see how Visplore updates.
Change it back to a '+', as we actually wanted a summation of absolutes, and press "Compute" again.
Important: Now press "Apply" to close the dialog, and thereby confirm the changes you made to the attribute. Pressing "Discard" would discard all changes we made in the dialog, leaving the attribute as before.
Formula examples
Here is a list of some formulas that may be helpful. Experiment a bit with them, and try to create some of your own. If you want to skip this now, continue to next section.
Examples of simple formulas typed by hand:| Duplicate to use attribute under different name | result = i |
| Difference of two attributes | result = i_1 - i_2 |
| Division of two attributes | result = i_1 / i_2 |
| Point-wise average of three attributes | result = (i_1 + i_2 + i_3) / 3 |
| Point-wise square | result = i * i |
Examples of built-in formulas (use the button  next to a built-in formula for detailed info about parameters):
| Moving average | result = MovingAverage(i, window=10, windowtype="datarecords", symmetric=True, order=i_order) |
| First derivative | result = Derive(i, order=i_order, method="centraldifferences") |
| Time-shift by constant value (here: 2 hours) | result = TimeShift(i, axis=i_order, shift=datetime.timedelta(hours=2)) |
| Time-shift to maximize correlation with other attribute | result = AutoAlign(i_1, basevector=i_2, axis=i_order, maxshiftleft=100, maxshiftright=0) |
| Uniform binning (produces a categorical data attribute) | result = UniformBinning(i, num_bins=10) |
Remember: you can technically use any Python 3 script in here, including loops, if-statements and others. Combining Python with built-in formulas is also possible.
Also see: Important examples for computing variables.
Binning of values - create a categorical time series
You can change use uniform binning to put numerical attributes into categorical groups. This is useful if you are not interested in the precise value e.g. 32.67 but rather that it is between 30 and 40. For this you can use the built-in formula "UniformBinning" with the approximate number of bins (approximate because it will use a clever method to create meaningful boundaries, e.g. integer values, and zero if it is contained...).
Select "Wind_Speed_Happyville_Weather" in the "Statistics" view
Then click on "New data attribute" and select "Categorical data attribute"
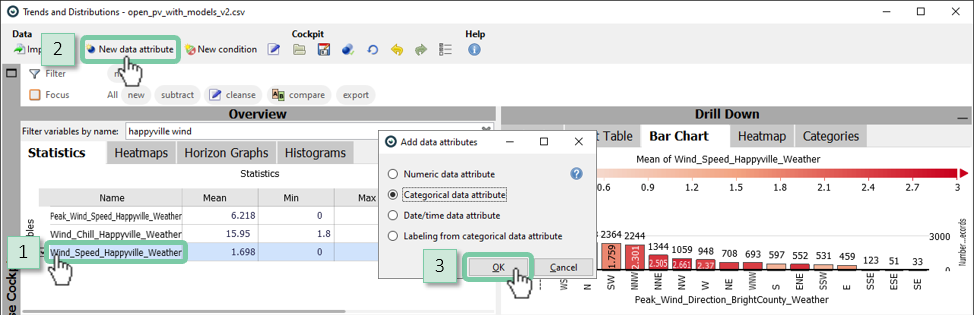
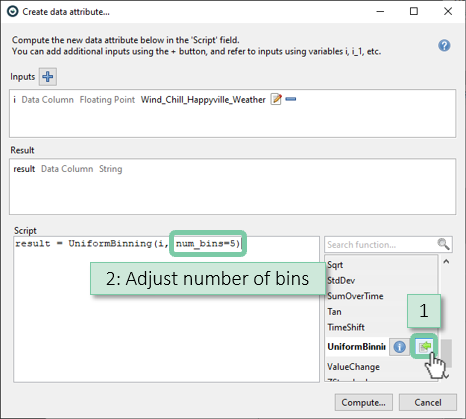
In the formula dialog click on "UniformBinning" and adjust the number of bins to create a binning with approximately 5 bins. Confirm by pressing "Compute" and "OK", and "OK" in the naming dialog.
Note: you can also create a Date/Time attribute, e.g. to combine a date and time from two separate attributes into one that can be used in Visplore. For this create a new Date/time data attribute, add your two inputs with the plus sign and use the formula "result = CombineDatetime(dates=i_1, times=i_2)".
Note: to generate logical (binary true/false) variables to indicate e.g. high wind events you can use so called conditions, by selecting the wind attribute as before, clicking on "New condition" and entering a condition such as "result = i > 14" to highlight high wind events larger than 14m/s. You can now put your new condition in focus. Also see: Defining new conditions for details.
Great! You can now perform simple calculations on your variables of different type such as numerical, categorical, time series and conditions.
>> Continue with Next lesson: Defining conditions
License Statement for the Photovoltaic and Weather dataset used for Screenshots:
"Contains public sector information licensed under the Open Government Licence v3.0."
Source of Dataset (in its original form): https://data.london.gov.uk/dataset/photovoltaic--pv--solar-panel-energy-generation-data
License: UK Open Government Licence OGL 3: http://www.nationalarchives.gov.uk/doc/open-government-licence/version/3/
Dataset was modified (e.g. columns renamed) for easier communication of Visplore USPs.