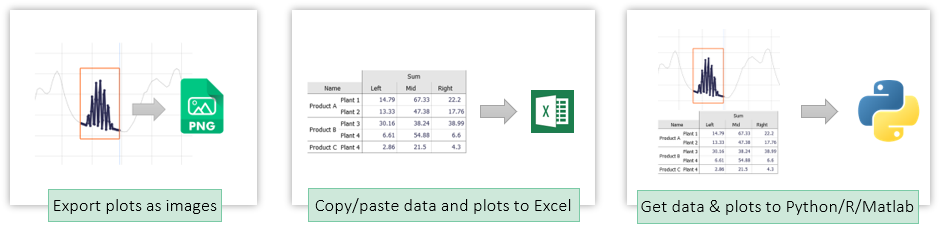
Exporting images and data
Visplore supports multiple ways of exporting information. The most important ones are exporting images, and exporting data tables. These can be exported either to the clipboard or a file.
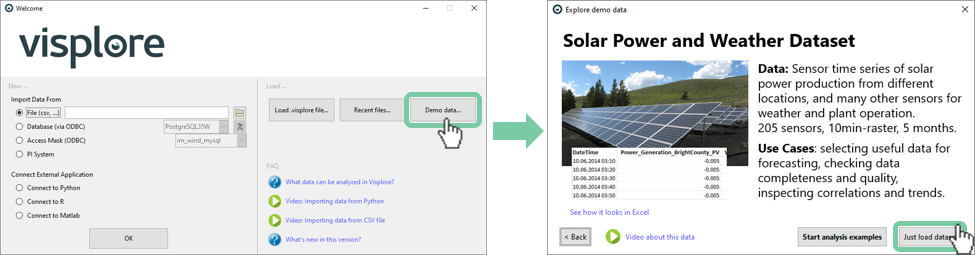
Preparation (to follow this lesson using demo data)
For the tutorial, load the solar power demo dataset from the welcome dialog, as shown below. Note: In Visplore Discovery/Professional, you need to click "Demo Data", and then "Solar Power"
Export diagrams as image
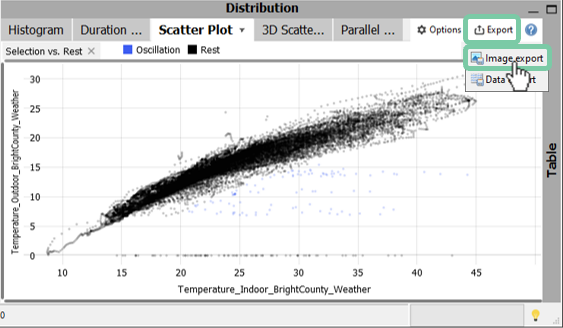
It is possible to export each diagram in Visplore as an image. Let's export a Scatter Plot, as found in the cockpit "Trends and Distributions", or "Correlations".
Ensure the Scatter Plot is visible, by selecting two time series, and clicking the view tab "Scatter Plot". Then, click the view title "Scatter Plot", and click the last option "Image export".
|
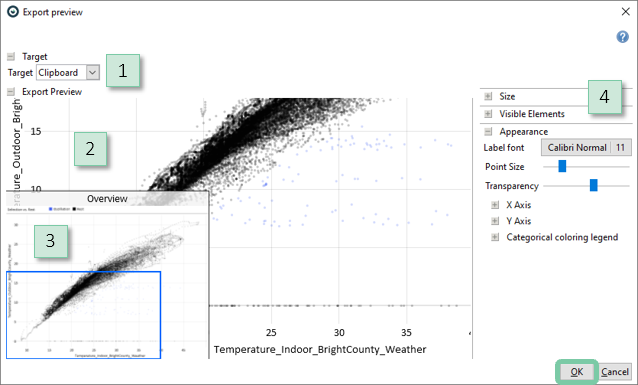
The dialog allows to change parameters of the image export:
|
Confirm the export by clicking "OK" in the dialog.
By default, this results in the image being copied to the clipboard. The image can then be pasted into other applications, such as Microsoft Word or Excel, by using Ctrl + V.
Export data of diagrams
Visplore offers numerous options for exporting selected raw data as well as aggregated values.
Export the data of the displayed "Statistics" table to the clipboard and paste the resulting table into another application of your choice (e.g. Microsoft Excel):
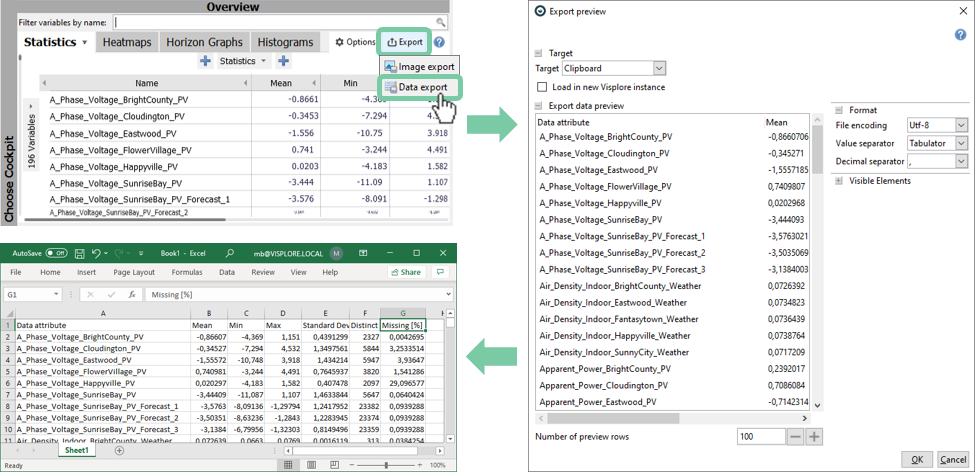
Similar to the image export dialog, the data export dialog allows to change some parameters of the export:
- Choose the target of the export. This can either be "Clipboard" (default) or "File".
- Preview of the data table to be exported.
- Change parameters of the export such as the format (e.g. the column separators), visibility of parts of the table (e.g. the diagram title), or other appearance aspects.
Export selected data subset
The currently selected data subset (i.e. the data in "focus") can be exported by pressing the "export" button in the focus bar, either to the clipboard, or to a file.
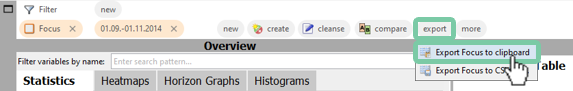
Export selected data to clipboard: By pressing the button in the title bar, the data records in focus are copied to the clipboard, in one of three ways. Then they can be inserted directly into tools such as Excel.
- as indicator variable (0/1), marking data records in focus: This exports a single, new time series as a column that is as long as the entire table, but has a "1" value in those rows that are in focus (i.e. have been selected). For non-selected records, the indicator time series has a value of "0". This column can be inserted directly in tools such as Excel next to the original table, for example, to process the selection information further using formulas.
- as indicator variable (0/1), plus time stamp and user-defined data attributes: In addition to the indicator time series, the respective time stamp (date/time) is written into a second column. Additionally, any user-defined data attributes such as named conditions, classifications, and predictions of trained regression models are exported.
- data records in focus (all data attributes, including user-defined): The actual values of the selected times are exported in tabular form. Rows of the table are only the records in focus, columns are all data attributes that are available in the cockpit (i.e. variables, categories). Additionally, any user-defined data attributes such as named conditions, classifications, and predictions of trained regression models are exported.
For all three types, the order of the rows corresponds to the order of the data records loaded into the cockpit in ascending order. When you press CTRL+C, the type of clipboard export that was last selected by mouse click is always executed (during the current execution of the cockpit, is not persistent). If no export has been performed yet (e.g. immediately after cockpit start), all records in focus are exported with CTRL+C (Third option of the list).
Export selected data as CSV: Exports records in focus to a csv-file. After selecting the export format and specifying a file name, the actual values of the selected records are exported in table form. This also includes user-defined data attributes such as predictions of trained regression models. Rows of the table are only all times in the focus, columns in this case are all imported time series (that is, independent of role assignment).
Using the "export" action in the focus bar is a simple way of making the results of data labeling and data editing available for other tools.
Exporting data table and view tables to Python, R, Matlab
See the API documentations of these connectors for examples, how to retrieve Visplore data from these environments
Well done! You have mastered the basics of exporting, to get your insights out of Visplore and back into your analytics workflow :)
>> Continue with Next lesson: Data filtering
License Statement for the Photovoltaic and Weather dataset used for Screenshots:
"Contains public sector information licensed under the Open Government Licence v3.0."
Source of Dataset (in its original form): https://data.london.gov.uk/dataset/photovoltaic--pv--solar-panel-energy-generation-data
License: UK Open Government Licence OGL 3: http://www.nationalarchives.gov.uk/doc/open-government-licence/version/3/
Dataset was modified (e.g. columns renamed) for easier communication of Visplore USPs.