R Connector (VisploreR v1.4.0)
Overview and Use-Cases
VisploreR is an R package to integrate Visplore cockpits into existing R workflows. It offers a bidirectional link between the R workspace and the interactive visual exploration features of Visplore. This supports multiple use-cases:
- Immediately start exploring data frames from any existing R workspaces.
- Clean outliers interactively in Visplore and get the cleaned data frame back.
- Select and label data subsets like patterns, clusters, or training data in Visplore, and making this information available for R.
- Visually debug R code by visualizing results at any point during execution.
- Validate predictions of R machine learning models visually in Visplore.
- Integrate datasets from multiple sources and importer packages in R, and send the merged/joined data table to Visplore for analysis.
Installation
Requirements:
- 64bit Windows
- 64bit R, Version 3.5 (or higher) environment, such as RGui, RStudio, etc.
Installation:
VisploreR comes as a R package in zip form, shipped with the Visplore installation. There are two ways of installing it:
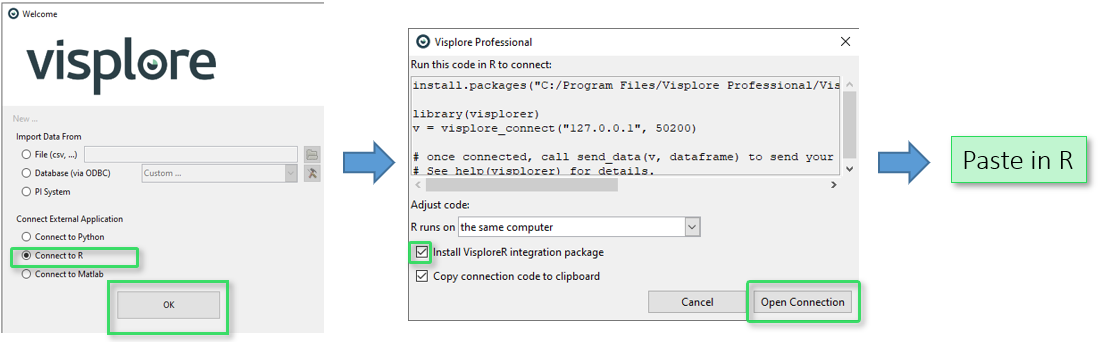
- From a running Visplore instance: in the startup dialog of Visplore, choose the "Connect to R" option, and select the "Install VisploreR integration package" checkmark. When confirming the dialog, a code snippet is produced that, when executed in your R environment, installs the R package and immediately connects R with that Visplore instance.
- Alternatively, you can use install.packages() in your R environment:
install.packages("C:/Program Files/Visplore/VisploreR/visplorer_0.1.0.zip", repos = NULL, type = "win.binary")
Note: You may need to adapt the path to match your Visplore installation.
Note: In some installations, you may be prompted to install the package "reticulate" during installation. Reticulate is used to convert R commands to python commands, which are internally used for talking to Visplore.
Note: When encountering any issues, please refer to our FAQ / Troubleshooting section for possible solutions.
Step by Step Guide
Once installed, this section describes how to start VisploreR, and sketches an example workflow to demonstrate its basic usage.
1) Connect R and Visplore
There are two ways to connect R and Visplore:
a) Start a new Visplore instance from R and connect to it, by typing the following:
library(visplorer)


v = visplore()
This opens a new Visplore instance, and stores a handle to it in a variable "v". Any number of Visplore instances can be created and used at the same time. The distinct handles are used to communicate with any particular instance.
Note: This way of starting Visplore is ideal when Visplore is installed via Installer locally on the same machine as the R environment . In other cases, refer to option (b), described in the following.
b) Connecting to an already running Visplore instance (locally, or on another machine):
This alternative is to start a new Visplore instance by hand first (e.g. via Start menu or desktop icon). In the welcome dialog of Visplore, choose the option "Connect to R". Confirming the dialog copies a code snippet to the clipboard, which you can paste and run in your R environment. It looks like this:
library(visplorer)


v = visplore_connect("127.0.0.1", 32708)
After pasting and running this snippet in R, the variable "v" is a handle to the existing Visplore instance you connected to. The tools communicate via TCP network protocol, which is why IP and port are specified as parameters here . Please leave these parameters as they are produced by Visplore. The Visplore instance waits for incoming connections on that port, and the "connect()" call establishes the connection.
2) Prepare a dataframe in R
A typical workflow starts with a data frame that is either already available in the R workspace, or loaded, generated, or accessed at this point. In our example, we use a pandas data frame, loaded from an open photovoltaic and weather dataset shipped with Visplore as csv file:
dat = load_demo_data('openpv_sampled')
3) Send dataframe to Visplore
We can now send this (or any other) data table to Visplore:
send_data(v, dat)
To see if your data successfully arrived at the Visplore instance, you can take a look at the statusbar at the bottom of your Visplore instance, and see if it shows any received records:

If something went wrong, it still shows:

4) Start a cockpit to explore the data
Once the data is available in Visplore, we can start a “Cockpit”, i.e., an entry point for a certain task or analysis question.
This can be done in one of two ways: either by a double click on the respective cockpit icon in Visplore, for example “Trends and Distributions”:
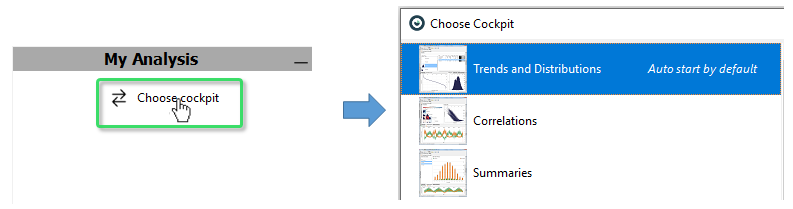
Alternatively, the cockpit can be started from R via the following command:
start_cockpit(v, "Trends and Distributions")
5) Interactively select data in Visplore, and make this information available in R
A key feature in Visplore is the selection of data records using interactive selection mechanisms (selection rectangles, Lasso brushes, etc.). This allows the user to select interesting subsets, like outliers, patterns, clusters, or training data for modeling interactively in Visplore. These subsets can be made available in R for downstream processing.
For example, you can drag an interval or rectangle with the left mouse in a “Time Series View” or “Histogram”, to select some data records, and then type the following command in R:
# retrieve selection of data

selected_mask = get_selection(v)
6) Label selected data in Visplore, and get labels in R
After selecting records in Visplore like in the previous step, the selected records can be labeled by clicking "create" in the "Focus" bar then selecting "Label" (see Visplore documentation). This creates a named condition, that can be retrieved as a binary mask from R using the following command. Say you selected outliers, and labeled them as a condition "Outliers", retrieve them with:
# retrieve selection saved as condition under the name "Outliers"

outlier_mask = get_condition(v, "Outliers")

plot(outlier_mask)
7) Clean data values in Visplore, and retrieve the cleaned data table as data frame
Visplore allows editing data records interactively, such as imputing outliers or missing values by interpolating neighbour values (see Visplore documentation).
In particular after peforming edits, but basically at any time, you can retrieve the current Visplore data table using:
new_data_frame = get_data(v)
get_data(v, limitToFocus=TRUE).
8) Get data from a Visplore visualization as data frame
Many table-like visualizations support retrieving the displayed data as new pandas data frame. Examples are statistical tables, bar charts, heat maps, and raw value tables.
my_statistics = get_view_data(v, "Statistics")
get_view_properties(v).
9) Get names of selected data attributes in Visplore, or set the selection of data attributes
When you interactively select data attributes in Visplore (e.g., in the "Statistics" view), retrieve the names of the selected attributes with:
get_selected_columns(v) #returns names as strings
set_selected_columns(), like this:
set_selected_columns(v, list("A_Phase_Voltage_FlowerVillage_PV", "A_Phase_Voltage_Happyville_PV"))
10) Compute new data columns in R, and make them available in Visplore
In this last example, a new data column is created in R by multiplying an existing column by 2. Use the send_data command with the "merge" parameter, to add the new column to the existing Visplore table:
# compute a new column: simply multiple one existing column by two, and send again.

dat[['A_Phase_Voltage_FlowerVillage_PV_multiplied']] = dat[['A_Phase_Voltage_FlowerVillage_PV']] * 2

send_data(v, dat['A_Phase_Voltage_FlowerVillage_PV_multiplied'], "merge")
But: When you update the values of an already displayed Visplore variable, e.g., running the snippet again and multiplying the values by 10 instead of 2, the values update immediately, allowing for efficient visual tweaking of parameters:
# update the values of the same column. Now this works instantly, without restarting the cockpit:

dat[['A_Phase_Voltage_FlowerVillage_PV_multiplied']] = dat[['A_Phase_Voltage_FlowerVillage_PV_multiplied']] * 10

send_data(v, dat['A_Phase_Voltage_FlowerVillage_PV_multiplied'], "merge")
API Documentation
Use help(visplorer) in R to produce this documentation:
closevisplore(...)
Closes the visplore application for this handle.
| Usage: | closevisplore(v) |
| Input parameters: | |
| v(mandatory, visplore handle) - the handle to the active Visplore instance | |
| Example: | |
# v is a visplore handle received by v = visplore() |
|
# |
|
closevisplore(v)
|
export_story_to_pdf(...)
Exports the currently active story to PDF.
| Usage: | export_story_to_pdf(v, filePath) |
| Input parameters: | |
| v(mandatory, visplore handle) - the handle to the active Visplore instance | |
| filePath(mandatory, string) - the location of the pdf export as string | |
| logoPath(optional, string) - the location of a logo image that is used on each page | |
| Example: | |
# v is a visplore handle received by v = visplore() |
|
# |
|
export_story_to_pdf(v, "C:/data/visplore_stories/my_story.pdf") |
|
get_classification(...)
Returns the classification(= categorical column) for the given name, if existing, as data frame.
| Usage: | get_classification(v, classificationName, mode) |
| Input parameters: | |
| v(mandatory, visplore handle) - the handle to the active Visplore instance | |
| classificationName(mandatory, string) - the name of the classification as string | |
| Return type: | |
| data.frame | |
| Example: | |
# v is a visplore handle received by v = visplore() |
|
# Assumes, that a classification column called 'Classification Nr. 1' has been created in Visplore. |
|
# |
|
c = get_classification(v,"Classification Nr. 1") |
|
# returns dataframe with the length of the Visplore table, and |
|
# the classification as categorical column. |
|
get_columns(...)
Returns the names of the columns in the current visplore table (optionally limited to the selected ones)
| Usage: | get_columns(v, selectedOnly, fullNames) |
| Input parameters: | |
| v(mandatory, visplore handle) - the handle to the active Visplore instance | |
| selectedOnly(optional, boolean) - if only the selected columns are returned, or all of them | |
| Default: FALSE | |
| fullNames(optional, boolean) - if True, the full Visplore attribute hierarchy path is used | |
| Default: FALSE Return type: | |
| list | |
| Example: | |
# v is a visplore handle received by v = visplore() |
|
# |
|
c = get_columns(v,selectedOnly=TRUE) |
|
# returns for example list('A_Phase_Voltage_BrightCounty_PV', 'A_Phase_Voltage_Cloudington_PV') |
|
get_condition(...)
Returns a list of boolean values, stating for each record of the Visplore table if it is part of the named condition (TRUE), or not (FALSE).
| Usage: | get_condition(v, name) |
| Input parameters: | |
| v(mandatory, visplore handle) - the handle to the active Visplore instance | |
| name(mandatory, string) - the name of a condition whose membership is returned | |
| Return type: | |
| list | |
| Example: | |
# v is a visplore handle received by v = visplore() |
|
# |
|
c = get_condition(v,"Outliers") |
|
# returns for example list(FALSE, TRUE, FALSE, TRUE), stating which records belong to |
|
# an existing named condition 'Outliers' |
|
get_data(...)
Returns the data table of Visplore as pandas data frame.
| Usage: | get_data(v, limitToFocus) |
| Input parameters: | |
| v(mandatory, visplore handle) - the handle to the active Visplore instance | |
| selectionName(optional, string) - Uses the given selection for the basis of the returned data. | |
| limitToFocus(optional, boolean) - Determines whether only data records that are in focus should be returned. | |
| Default: FALSE | |
| Return type: | |
| data.frame | |
| Example: | |
# v is a visplore handle received by v = visplore() |
|
# |
|
data = get_data(v) |
|
get_filter(...)
Returns a list of boolean values, stating for each record of the Visplore table if it passes the current Visplore filter (TRUE) or not (FALSE).
| Usage: | get_filter(v) |
| Input parameters: | |
| v(mandatory, visplore handle) - the handle to the active Visplore instance | |
| Return type: | |
| list | |
| Example: | |
# v is a visplore handle received by v = visplore() |
|
# |
|
c = get_filter(v) |
|
# returns for example list(TRUE, TRUE, TRUE, FALSE, TRUE, ..., TRUE)
|
get_selected_columns(...)
Returns the names of the currently selected columns in the current visplore table
| Usage: | get_selected_columns(v, fullNames) |
| Input parameters: | |
| v(mandatory, visplore handle) - the handle to the active Visplore instance | |
| fullNames(optional, boolean) - if True, the full Visplore attribute hierarchy path is used | |
| Default: FALSE | |
| Return type: | |
| list | |
| Example: | |
# v is a visplore handle received by v = visplore() |
|
# |
|
c = get_selected_columns(v) |
|
# returns for example list('A_Phase_Voltage_BrightCounty_PV', 'A_Phase_Voltage_Cloudington_PV', ...)
|
get_selection(...)
Returns a list of boolean values, stating for each record of the Visplore table if it is part of (1) the current Focus or (2) a named condition, if name is specified.
| Usage: | get_selection(v, name) |
| Input parameters: | |
| v(mandatory, visplore handle) - the handle to the active Visplore instance | |
| name(optional, string) - name of a condition whose membership is returned. | |
| If not specified, membership of the current Focus is returned. | |
| Is equivalent to calling get_condition(name). | |
| Return type: | |
| list | |
| Example: | |
# v is a visplore handle received by v = visplore() |
|
# |
|
s = get_selection(v) |
|
# returns for example list(TRUE, FALSE, FALSE, FALSE), stating that only the |
|
# first record is currently in Focus. |
|
# |
|
s = get_selection(v, "Outliers") |
|
# returns for example list(TRUE, FALSE, FALSE, FALSE), stating which records belong to |
|
# an existing named condition 'Outliers' |
|
get_view_data(...)
Returns the contents of a particular Visplore view as data frame.
Is not applicable for all views. Call get_view_properties() to see, which views of the current Cockpit support this.
Supported examples : 'Statistics', 'Focus data records', 'Calendar', 'Histogram'
Attention : at the moment, get_view_data is only possible for views that are visible in Visplore, not views hidden in tabs. Open them first.
| Usage: | get_view_data(v, view_id) |
| Input parameters: | |
| v(mandatory, visplore handle) - the handle to the active Visplore instance | |
| view_id(mandatory, string) - the ID of the view whose contents are to be retrieved. | |
| In most cases, this is the name displayed as view title in Visplore. | |
| See get_view_properties() to see the View IDs, and if a view supports this. | |
| Return type: | |
| data.frame | |
| Example: | |
# v is a visplore handle received by v = visplore() |
|
# |
|
stats = get_view_data(v, "Statistics") |
|
get_view_properties(...)
Returns a table stating for each view
- the view ID needed for API calls to it
- if the view is exportable via API calls
| Usage: | get_view_properties(v) |
| Return type: | |
| data.frame | |
| Example: | |
# v is a visplore handle received by v = visplore() |
|
# |
|
props = get_view_properties(v) |
|
load_demo_data(...)
Loads a prepared data set that is delivered with Visplore as a data.frame.
| Usage: | load_demo_data(data) |
| Input parameters: | |
| data(optional, string) - The identifier of the data set. | |
| Supported data sets are: | |
| 'openpv_sampled': A sampled set of the Open Photovoltaic and Weather data set. | |
| 'openpv': The full Open Photovoltaic and Weather data set. | |
| Default: 'openpv_sampled' | |
| Example: | |
test_data = load_demo_data()
|
load_session(...)
Loads a visplore session with the given filename(full path)
| Usage: | load_session(v, filename) |
| Input parameters: | |
| v(mandatory, visplore handle) - the handle to the active Visplore instance. | |
| filename(mandatory, string) - string specifying full name and path of visplore file | |
| restoreMode(optional, string) - string specifying the mode on how data is restored when loading a session | |
| supported modes are: auto, askUser, fromEmbedded, fromLink, fromLinkWithDialog, no | |
| Example: | |
# v is a visplore handle received by v = visplore() |
|
# |
|
load_session(v, "C:/data/visplore_sessions/my_dashboard.visplore") |
|
save_image(...)
Exports a view as image, with optional parameters, and saves it as PNG file to a location.
| Usage: | save_image(v, view_id, filename, parameters) |
| Input parameters: | |
| v(mandatory, visplore handle) - the handle to the active Visplore instance. | |
| view_id(mandatory, string) - the ID of the view to export as image. | |
| In most cases, this is the name displayed as view title in Visplore. | |
| See get_view_properties() to see the View IDs, and if a view supports this. | |
| filename(mandatory, string) - full path of image to create, including the file extension. | |
| parameters(optional, list) - in this optional list, you can customize the image export, | |
| using any of the following parameters: | |
| - width, height (int): the total width/height of the image in pixels. | |
| - colwidth, rowheight (int): alternatives to total width and height, for views that have rows or columns, for example: | |
| Statistics, Heatmaps, Bar Chart, Heatmap,... | |
| - colwidth defines the width per column in px, | |
| - rowheight defines the height per row in px. | |
| - font (string): defines font type and size for all text in the image, for example, "Arial 16", or "Tahoma 20" | |
| - xaxislabel (boolean or string): set to False to hide the x axis label, or specify as string to show a custom x axis label. | |
| - yaxislabel (boolean or string): set to False to hide the y axis label, or specify as string to show a custom y axis label. | |
| - labelfont (string): format for the label's font type and size, see below. | |
| - colorlegend (boolean or string): set to False to hide color legends, or specify as string to show a custom legend label | |
| - visiblerangebars (boolean): set to False to hide scrollbars. | |
| - missingdatabar (boolean): set to False to hide info-bars above some plots. | |
| - context (boolean): set to False to show only data records that are in Focus. | |
| - selectionhandles (boolean): set to False to hide orange selection tool handles. | |
| - title (boolean or string): set to True to show the view name as title, or specify as string to show a custom title. | |
| - titlefont (string): format for title's font type and size, see below. | |
| - description (boolean or string): set to True to show the Focus description in image, or specify a string to show a custom description text. | |
| - descriptionfont (string): format string for description's font type/size, see below. | |
| - arealabel (boolean or string): Only available in some(aggregated) views. Set to False to hide the area label, or specify as string to show a custom area label. | |
| - rightyaxislabel (boolean or string): Only available in some(aggregated) views. Set to False to hide the right y axis label, or specify as string to show a right y axis label. | |
| - topxaxislabel (boolean or string): Only available in some(aggregated) views. Set to False to hide the top x axis label, or specify as string to show a top x axis label. | |
| Examples: | |
# v is a visplore handle received by v = visplore() |
|
# Export a view in default size and settings: |
|
save_image(v, "Time Series", "C:/temp/image.png") |
|
# Export in specific size: |
|
save_image(v, "Time Series", "C:/temp/image.png", list(width = 1000, height = 400)) |
|
# Export with specific font: |
|
save_image(v, "Time Series", "C:/temp/image.png", list(font = "Arial 16", title = "My Plot")) |
|
send_data(...)
Sends data to visplore, either replacing the current visplore table, or extending it.
| Usage: | send_data(v, data, mode, tableDescription) |
| Input parameters: | |
| v(mandatory, visplore handle) - the handle to the active Visplore instance | |
| data(mandatory, data.frame) - supported column types are numerical, categorical, or timestamp attributes. | |
| mode(optional, string) - a string that defines how the data is combined with a | |
| possibly existing table in visplore. | |
| Options : ('replace', 'merge', 'append', 'auto') | |
| Default: 'auto' | |
| tableDescription(optional, string) - an optional table description that is shown in the title bar of Visplore. | |
| If not specified, the data type or variable name is shown | |
| Return type: | |
| data.frame | |
| Example: | |
# v is a visplore handle received by v = visplore() |
|
# |
|
send_data(v, df) |
|
# df is any dataframe |
|
set_selected_columns(...)
Selects the columns in Visplore that are specified by a list column names(strings).
| Usage: | set_selected_columns(v, columnNames) |
| Input parameters: | |
| v(mandatory, visplore handle) - the handle to the active Visplore instance | |
| columnNames(mandatory, list) - a list of strings specifying exact names of columns to select in Visplore. | |
| In the same format, as retrieved by get_selected_columns() | |
| Example: | |
# v is a visplore handle received by v = visplore() |
|
# |
|
li<-c("A_Phase_Voltage_BrightCounty_PV", "A_Phase_Voltage_Cloudington_PV") |
|
set_selected_columns(v, li) |
|
set_selection(...)
Sets the current Focus of data records to those records marked in the provided sequence of boolean values.
Optionally also stores these records as a named condition.
| Usage: | set_selection(v, sequence, description, name) |
| Input parameters: | |
| v(mandatory, visplore handle) - the handle to the active Visplore instance | |
| sequence(mandatory, list) - the records to select(where TRUE). Must be length of the Visplore table. | |
| description(optional, string) - a selection description, optional | |
| possibly existing table in visplore. | |
| name(optional, string) - is the name of a named condition to create and set from these records. | |
| Example: | |
# v is a visplore handle received by v = visplore() |
|
# |
|
set_selection(v, list(TRUE, FALSE, FALSE)) |
|
# sets the Focus to contain only the 1st record of a 3-record table. |
|
start_cockpit(...)
Starts a cockpit with the given name, if such a cockpit exists.
| Usage: | start_cockpit(v, cockpit) |
| Input parameters: | |
| v(mandatory, visplore handle) - the handle to the active Visplore instance | |
| cockpit(mandatory, string) - is the name of the cockpit that should be started. | |
| skipRolesDialog(optional, bool) - if True: signals to Visplore to attempt to automatically assign roles | |
| The role assignment dialog is shown if no automatic role assignment is possible | |
| Example: | |
# v is a visplore handle received by v = visplore() |
|
# |
|
start_cockpit(v, 'Trends and Distributions') |
|
visplore(...)
Starts a new instance of visplore and returns a handle to it.
The location of visplore.exe is assumed to be found in an environment variable,
called VISPLORE_LOCATION, which is set by the Visplore installer, or by you.
Alternatively, you can specify a different visplore location by a parameter.
As a third option, the VisploreStarter application can be used (legacy support).
Further optional parameters allow specify a cockpit to start, and passing data.
| Usage: | visplore(local_visplore, path) |
| Input parameters: | |
| local_visplore(optional, bool) - whether a local Visplore installation is started. | |
| Is possible if Visplore was installed by installer, or | |
| when you set VISPLORE_LOCATION to path/visplore.exe manually. | |
| Default: TRUE. If False, the VisploreStarter app is used. | |
| path(optional, string) - if specified, and the local_visplore parameter is set to True, a local | |
| visplore.exe is started from this location instead of VISPLORE_LOCATION.. | |
| Example: | |
# Start a new visplore instance from a local installation |
|
v = visplore() |
|
# |
|
# Start a new visplore instance from an installer-less Visplore in a different directory |
|
v = visplore(local_visplore=True, path="C:/temp/Visplore/Visplore/visplore.exe") |
|
visplore_connect(...)
Connects to an already running Visplore instance.
Uses TCP IP connection. By specifying the IP + port pair, you can either connect to a local Visplore, or to a Visplore running on another machine.
| Usage: | visplore_connect(ip,port) |
| Input parameters: | |
| ip(mandatory, string) - ip address of the Visplore instance (e.g. "127.0.0.1") | |
| port(mandatory, int) - the port that Visplore is listening to (e.g. 50123) | |
| you find the port in the 'Connect to Python' option in Visplore's welcome dialog. | |
| Example: | |
v = visplore_connect("127.0.0.1", 70010)
|
visplore_connect_local(...)
Connects to a local, already running Visplore instance.
| Usage: | visplore_connect_local(port) |
| Input parameters: | |
| port(optional, int) - the port that Visplore is listening to (e.g. 50123) | |
| If not given, tries to find the last started Visplore instance. | |
| Example: | |
v = visplore_connect_local()
|
FAQ / Troubleshooting
1) R freezes when calling 'library(visplorer)'
When loading the visplorer library in R, it may happen that the R distribution freezes.The cause of this problem is an already installed version of Rcpp. The internally used package reticulate uses Rcpp. However, when compiling Rcpp, the package does not support backcompatibility to older versions.
To fix this issue one should update the Rcpp installation to the newest version available. This can be done by either:
- Calling remove.packages("Rcpp") with a subsequent call of install.packages("Rcpp") or
- Manually deleting the installation folder of the Rcpp and then calling install.packages("Rcpp").