Cleansing outliers and gaps
A key use-case of Visplore is cleaning outliers, gaps and other anomalous data on the fly. On the one hand, this is important to avoid introducing a bias in the analysis (statistics, visualizations,..) due to data quality issues. On the other hand, the clean data can be exported with one click for follow-up tasks. Visplore can thus be seen as a flexible graphical data editor, that supports identifying data quality issues and cleaning them on-the-fly.

Note: any data modifications made in Visplore will stay only within the scope of your Visplore analysis. You can export changed data, but unless you decide to write it back to original sources by hand or by external means, the original data is not changed. Also, please note that saving Visplore files that contain data modifications requires the "Embed data" flag to be checked, when saving a Visplore file.
This step by step guide assumes you have loaded the 'Solar Power' demo dataset, and started the 'Trends and Distributions' Cockpit, as described in the beginning of the first step by step guide.
Selecting and cleansing outliers
Cleanse outliers in the time series plot:
Select "Temperature_Outdoor_BrightCounty_Weather" (e.g. search for "temp br").
Note: for simplicity, we recommend to have only one variable selected for this at first.
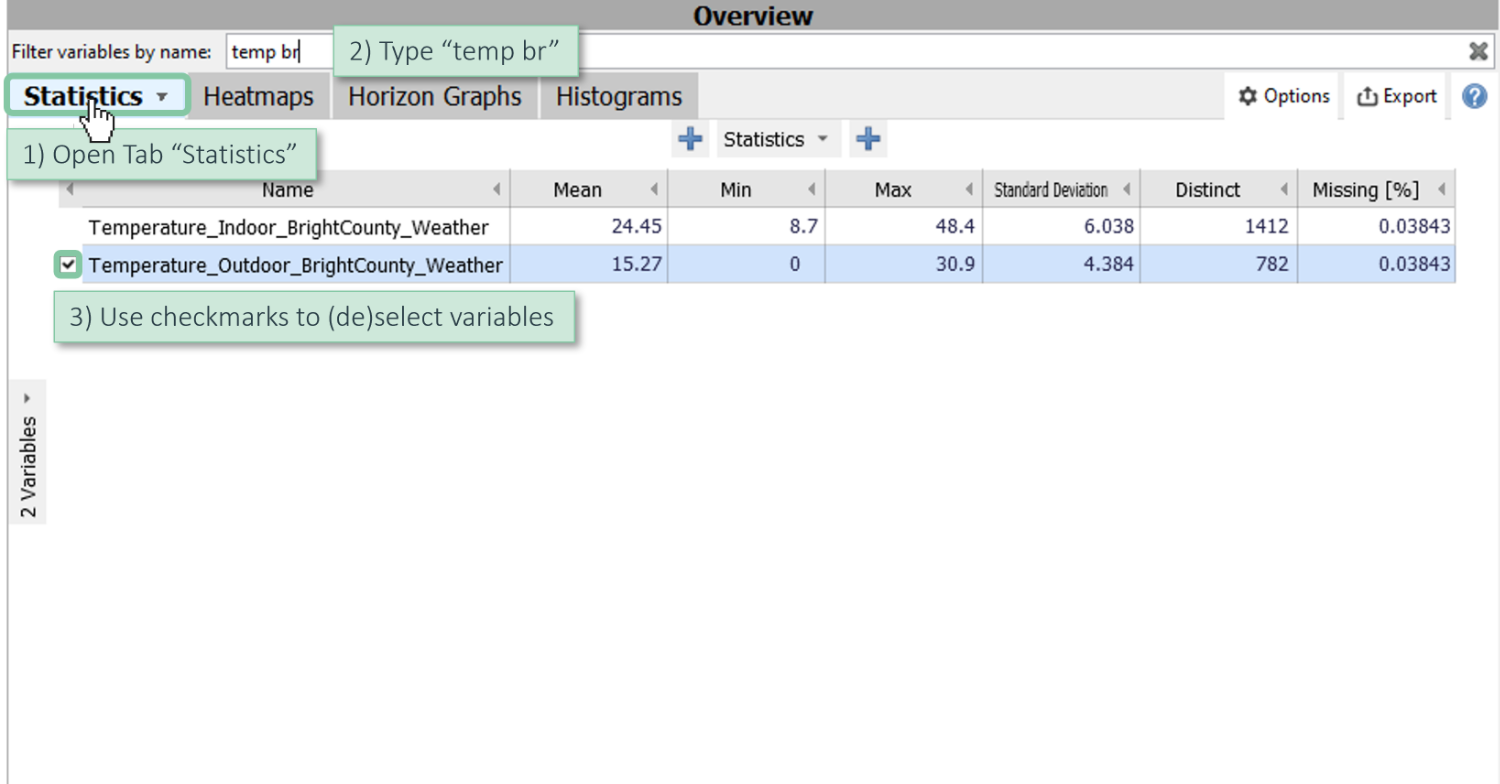
Drag an orange rectangle with the left mouse button.
Click on "cleanse", choose "Linear interpolation" and accept the data editing (yellow bar showing up).
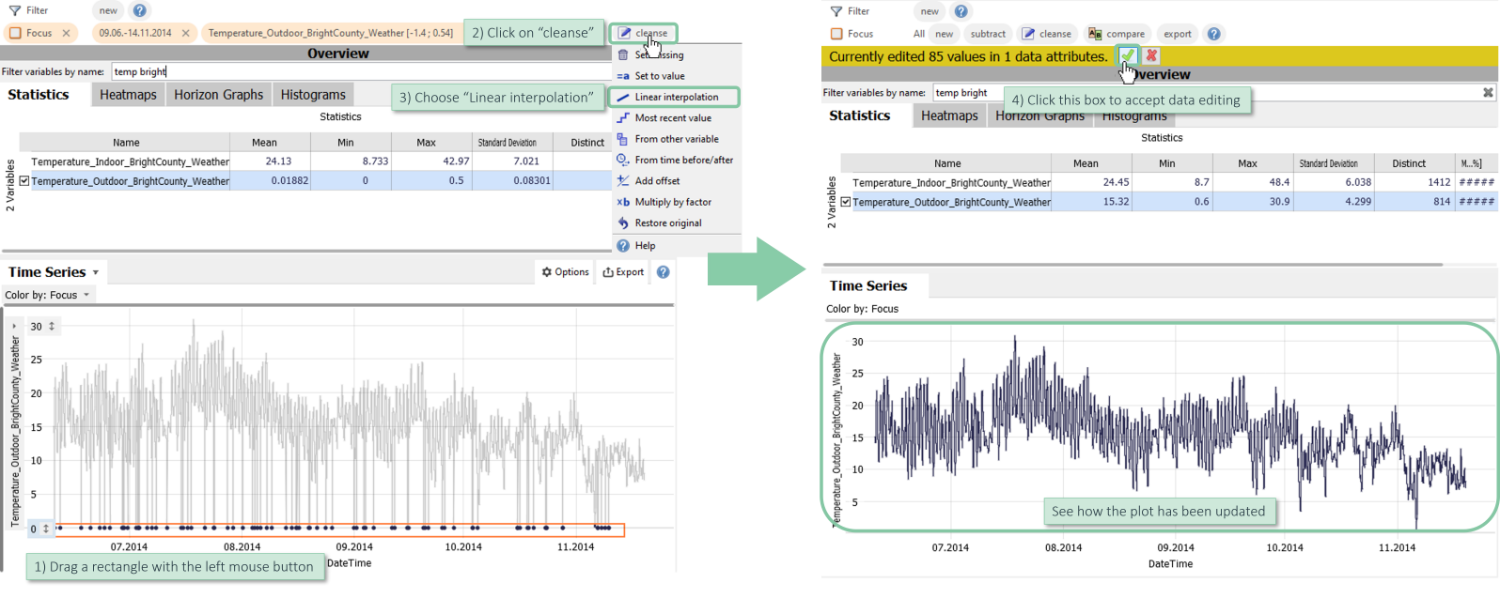
Note: instead of linear interpolation, you could also set the selected values to a constant value ('Set to value') or choose from a variety of editing operations described in the Appendix.
Note: if you have selected more than one data attribute when clicking "Cleanse", a dialog will ask, for which of them the selected records should be edited (see an example in the next section).
Note: you can restore the original values as described in the later section "Restoring the original values".
Cleanse outliers in other views (e.g. Scatter Plot):
You can also select outliers in other diagrams, and trigger the editing operation from there.
Select "Temperature_Indoor_BrightCounty_Weather" and open the "Scatter Plot" in the "Distribution" area.
Switch to the Lasso Selection (diagram title / selection mode / lasso).
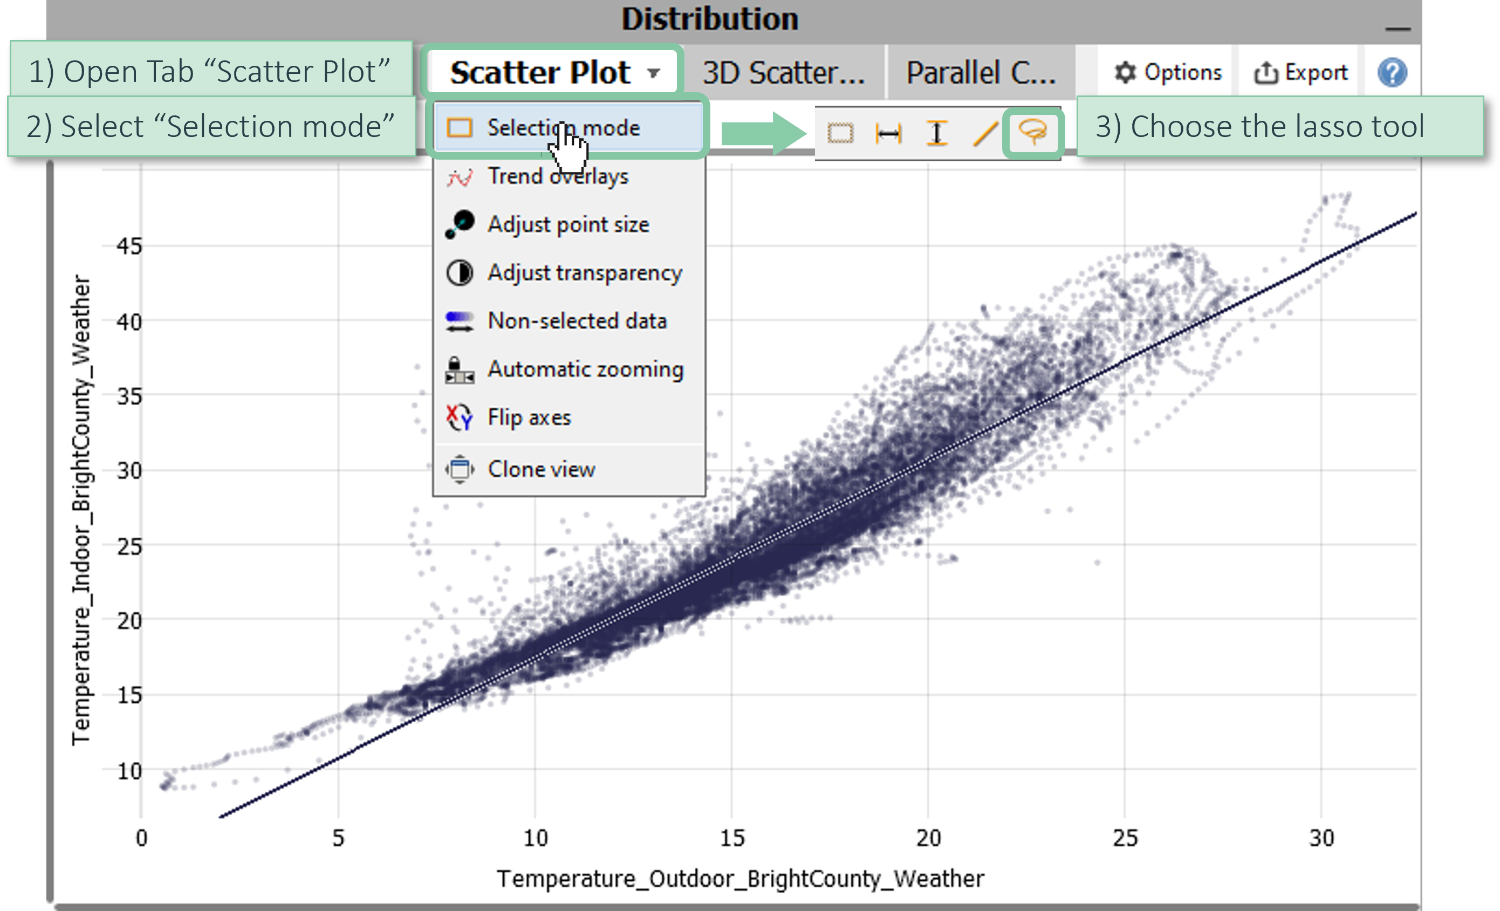
Select the outlier points by dragging a lasso.
Click "Cleanse / set missing" and choose both variables to be affected.
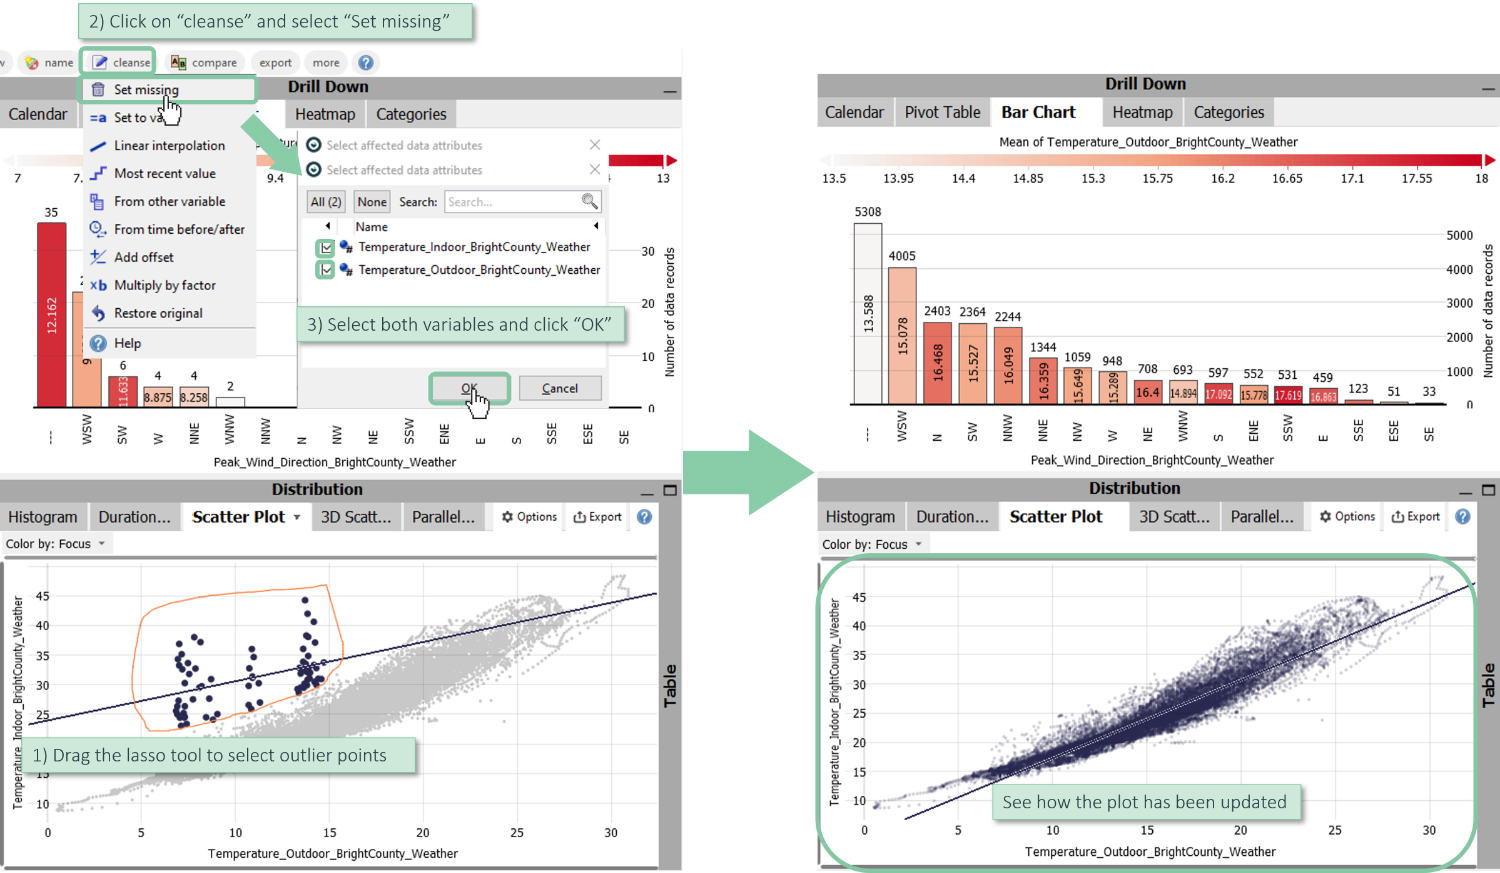
Note: when applying an editing operation to multiple variables, it is applied to each variable individually (e.g. when using 'linear interpolation').
Note: it is also possible to use an outlier test as selection rule, instead of selecting within the graphics. For this, click the word "new" in the Focus bar, then "Outlier selection". Next, choose the affected variables, and adjust parameters for the detection method. After confirming, any data records that are outliers in any chosen variable are selected and highlighted - but when performing a cleansing operation for this selection, only the outliers of each variable are cleaned - individually.
Selecting and cleansing gaps (missing values):
Select and fill missing values in time series plot:
Select only time series "Temperature_Outdoor_BrightCounty_Weather" (by click on name).

Click on "Time Series", select "Continuous/discrete" and enable "Higlight missing values".

Now, the missing values are highlighted as red areas.
Note: this only highlights times, where a time stamp (=data record) exists in the table, but the currently visualized variable has no values. Gaps in time, where no data records exist at all, are not detected/visualized.
Click the right mouse button and drag a blue rectangle to zoom in.
Click the left mouse button, drag an orange rectangle around missing values (red lines) and click "cleanse" / "Linear interpolation".
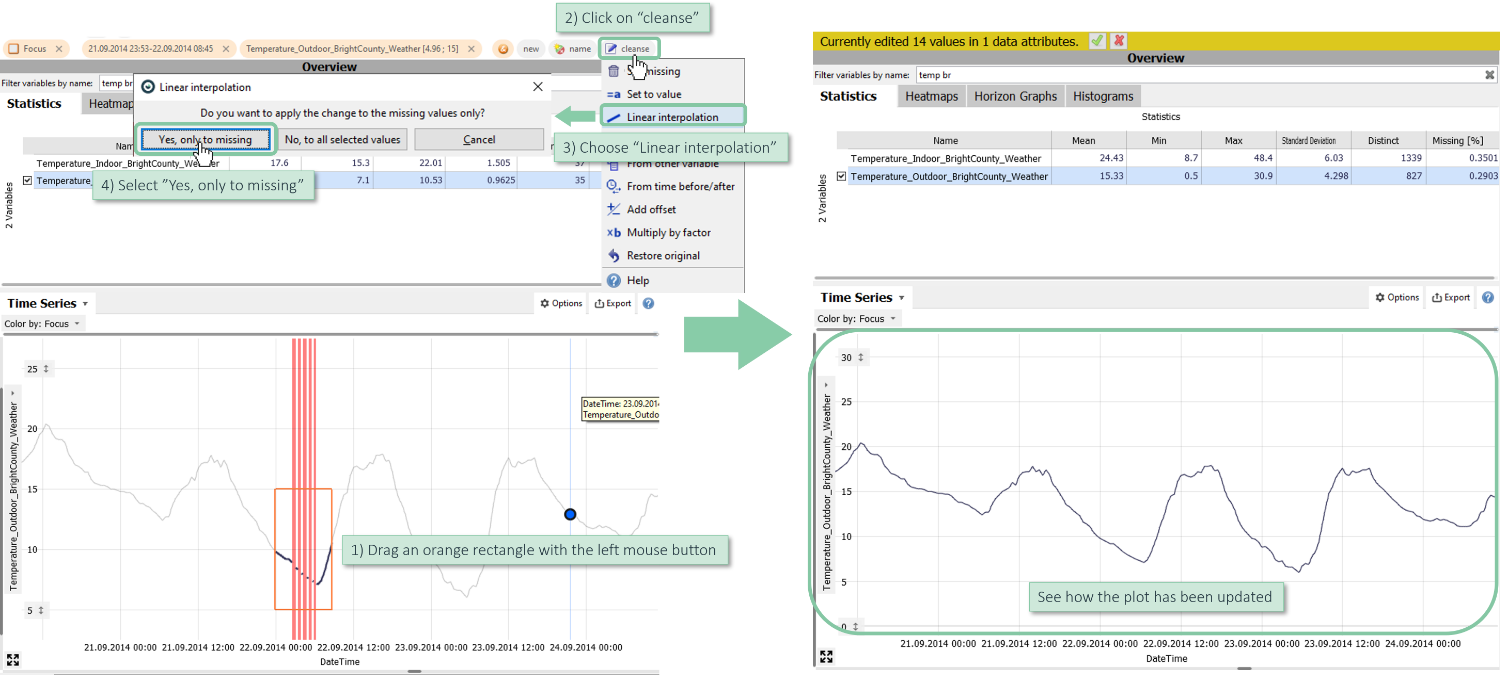
Note: longer gaps can be filled with the operations "From time before/after" or "From other variable".
Select all missing values of variables:
Alternatively, you can select all missing values of one or multiple variables.
Click "new" in the Focus bar and choose "Missing Values selection".
Select both temperature time series from Bright County.
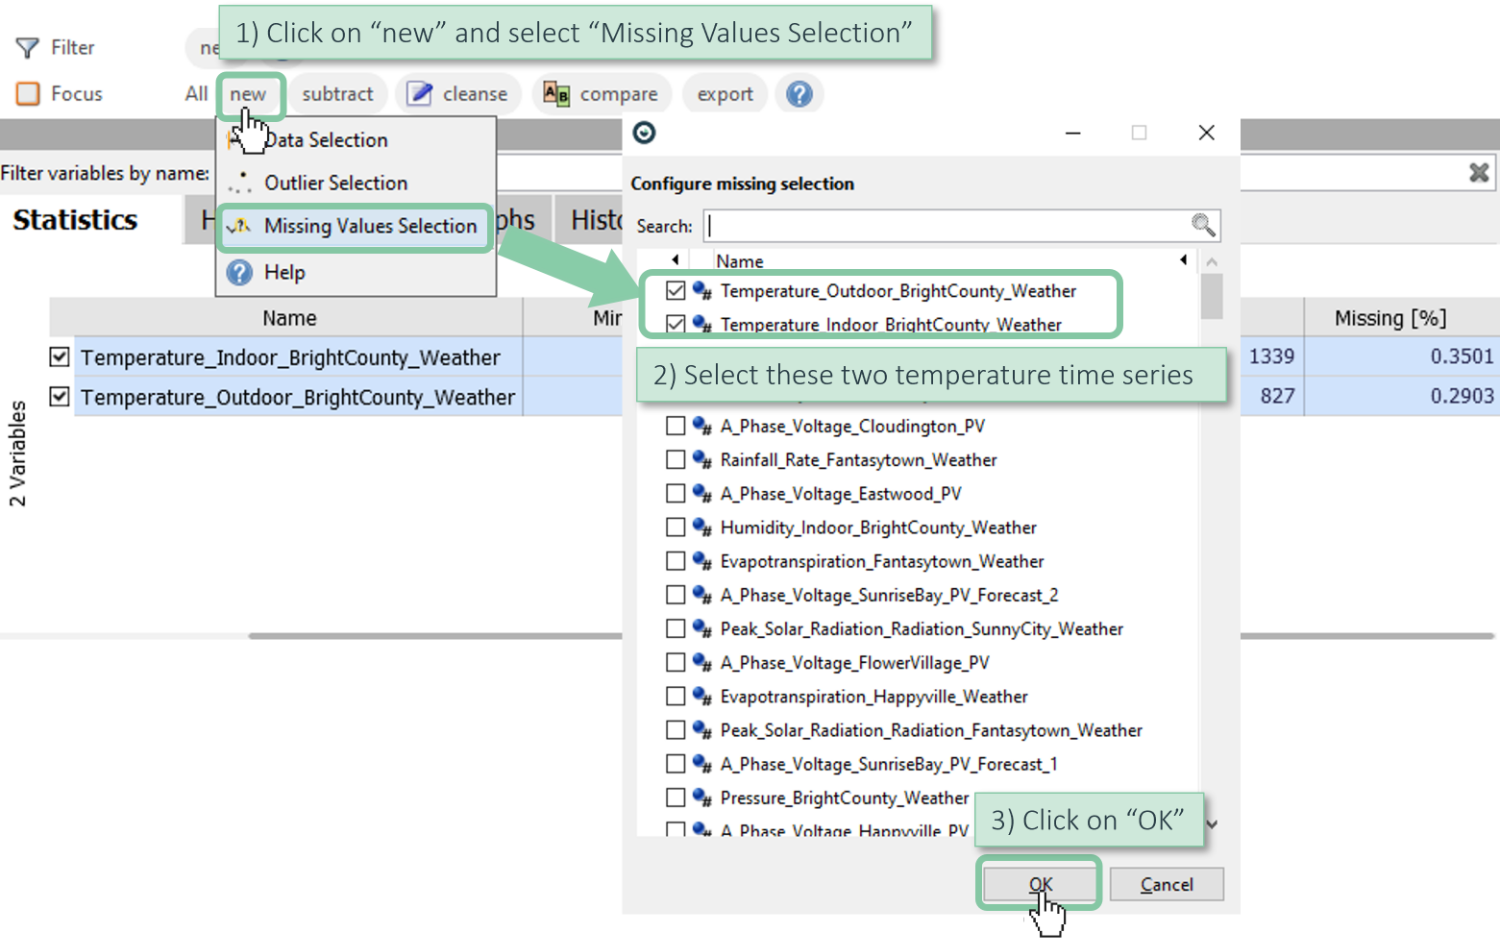
In the footer line, you can see how many data records have been selected.

The visualizations now highlight all data records, where any chosen data attribute is missing.
Select both temperature time series, click on "Cleanse" and choose "Linear interpolation".
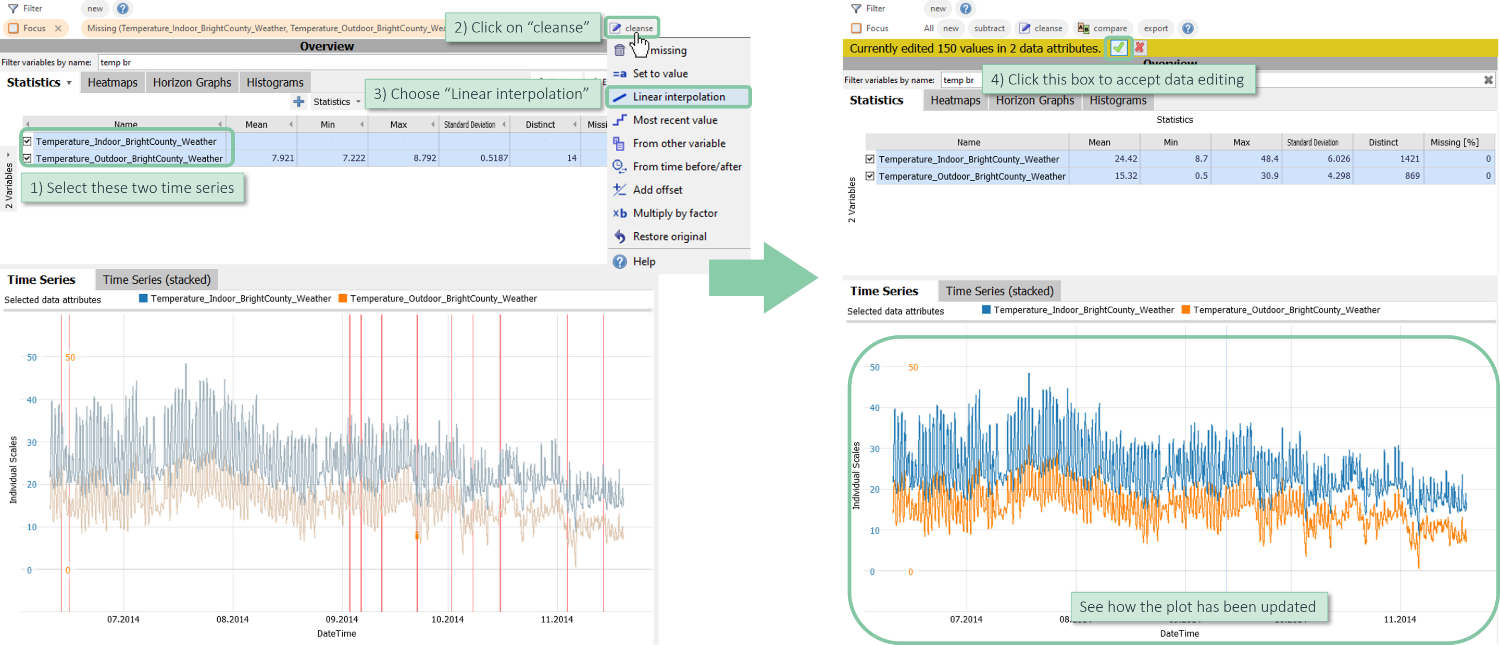
This individually cleans the missing values of each chosen attribute. Note, how all the red lines are gone from the visualization.
Interpolating only short gaps
Search/select "Temperature_Outdoor_Happyville_Weather" and select all missing values with "new" / "Missing Values Selection".
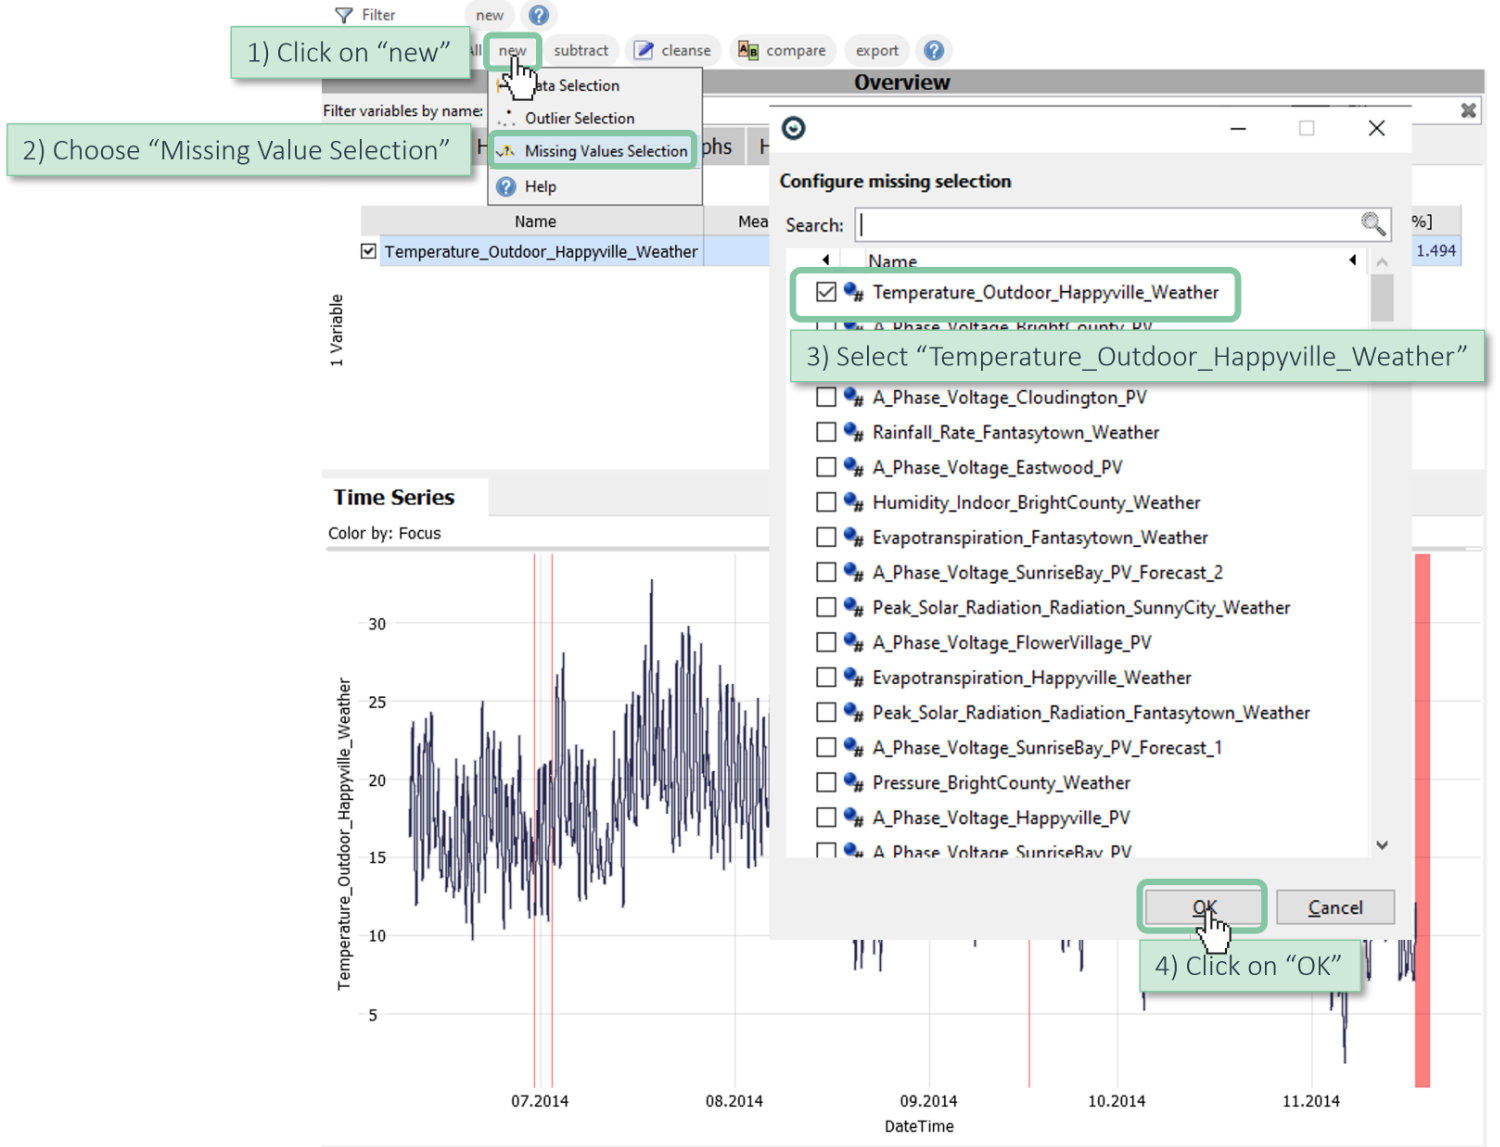
We would like to select only the short missing periods for interpolation, e.g. all shorter than 3 hours. For this, we can turn the selection into a named "Condition" object, which offers such possibilities:
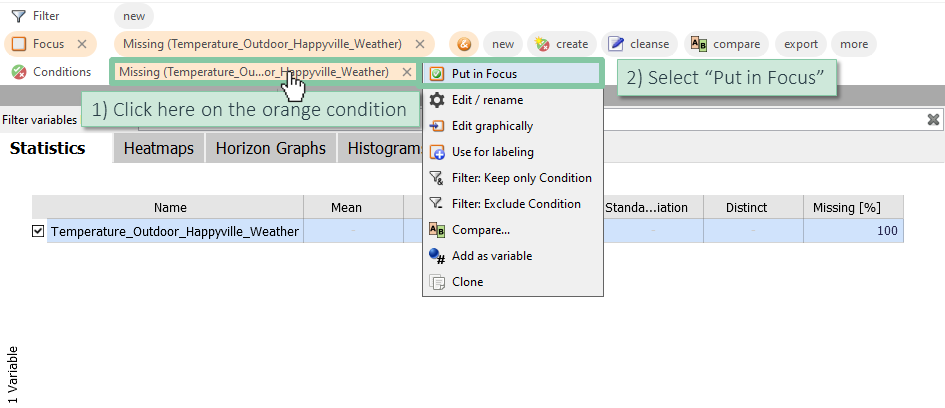
Click "Create" / "Condition" to create a named condition from this selection. Give it a name, and open "Advanced", to specify a "Max Duration" of 3 Hours.

Click on the orange representation of the condition and select "Put in Focus".
Now, click on "cleanse" and select "Linear interpolation".
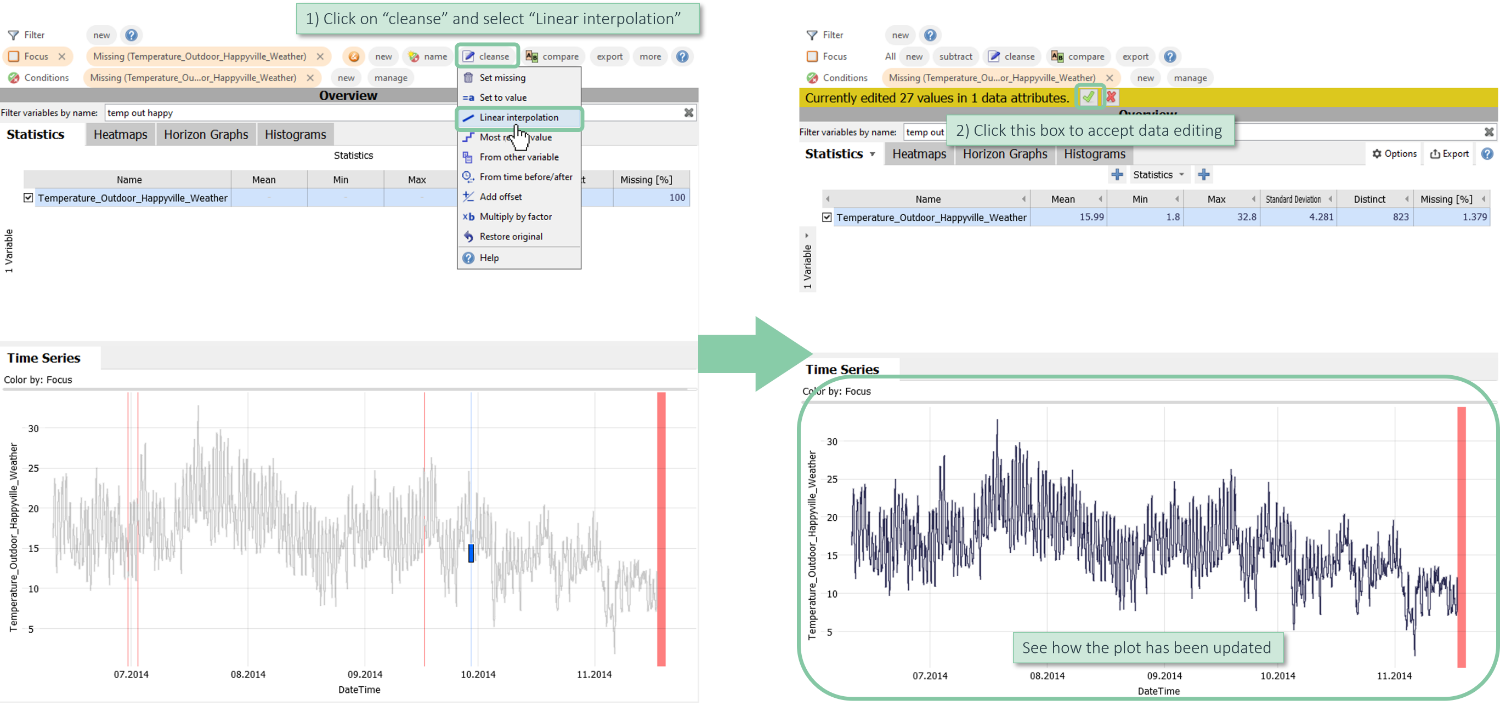
Note: you can apply the same method to select only long anomalous periods, by specifying a minimal duration to select.
Cleaning categorical data by renaming categories
Oftentimes, there are inconsistencies in categorical data that should be resolved, e.g., by merging or renaming categories (especially if manually entered).
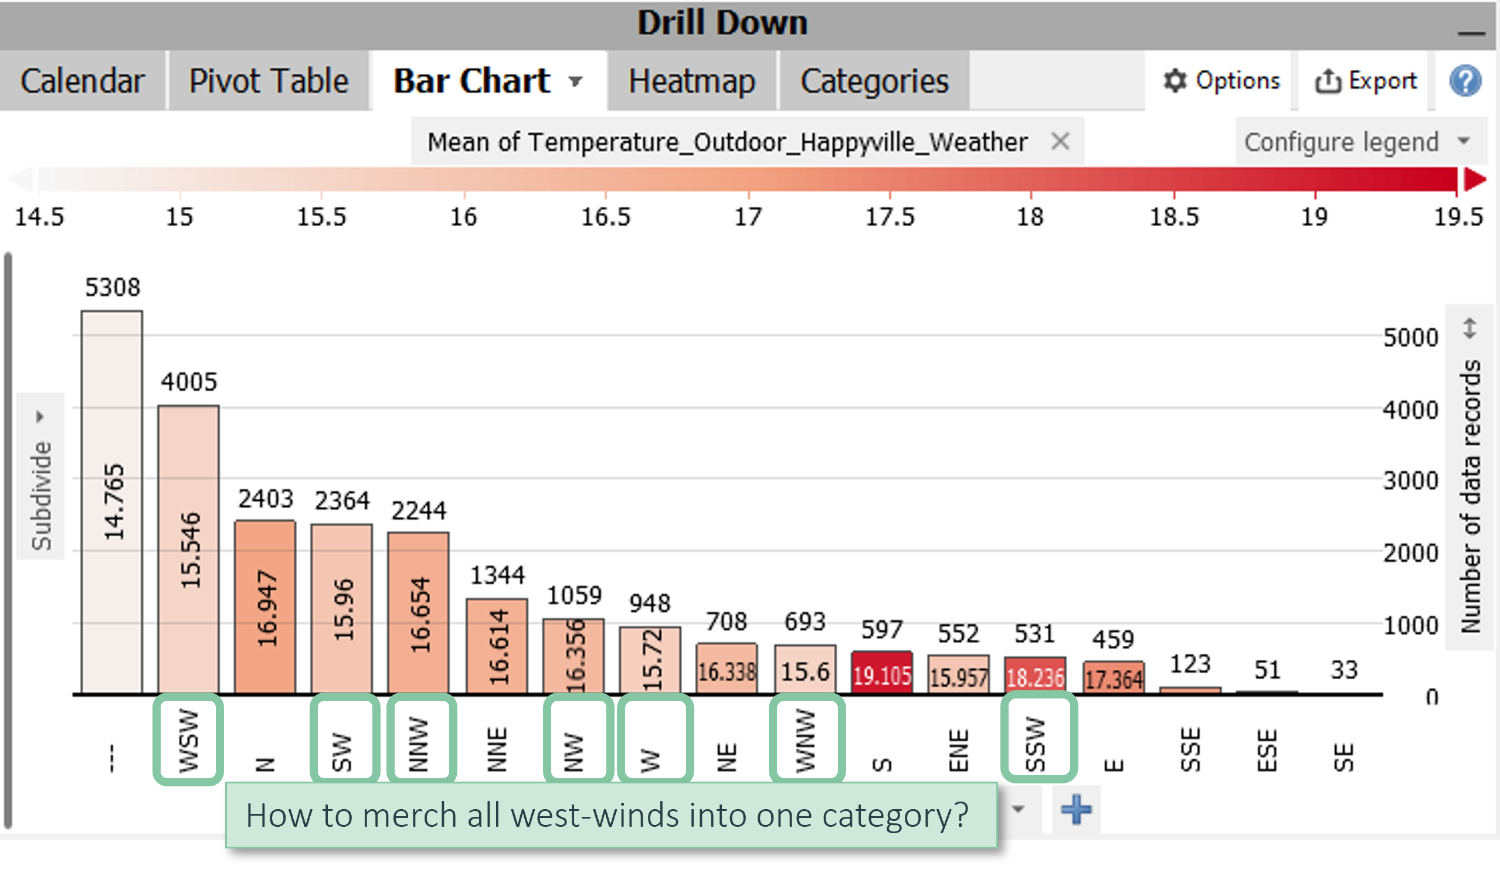
In this example, we have discrete wind directions, and would like to consider roughly all west-winds as one category. This means, all categories containing the letter "W" in this category:
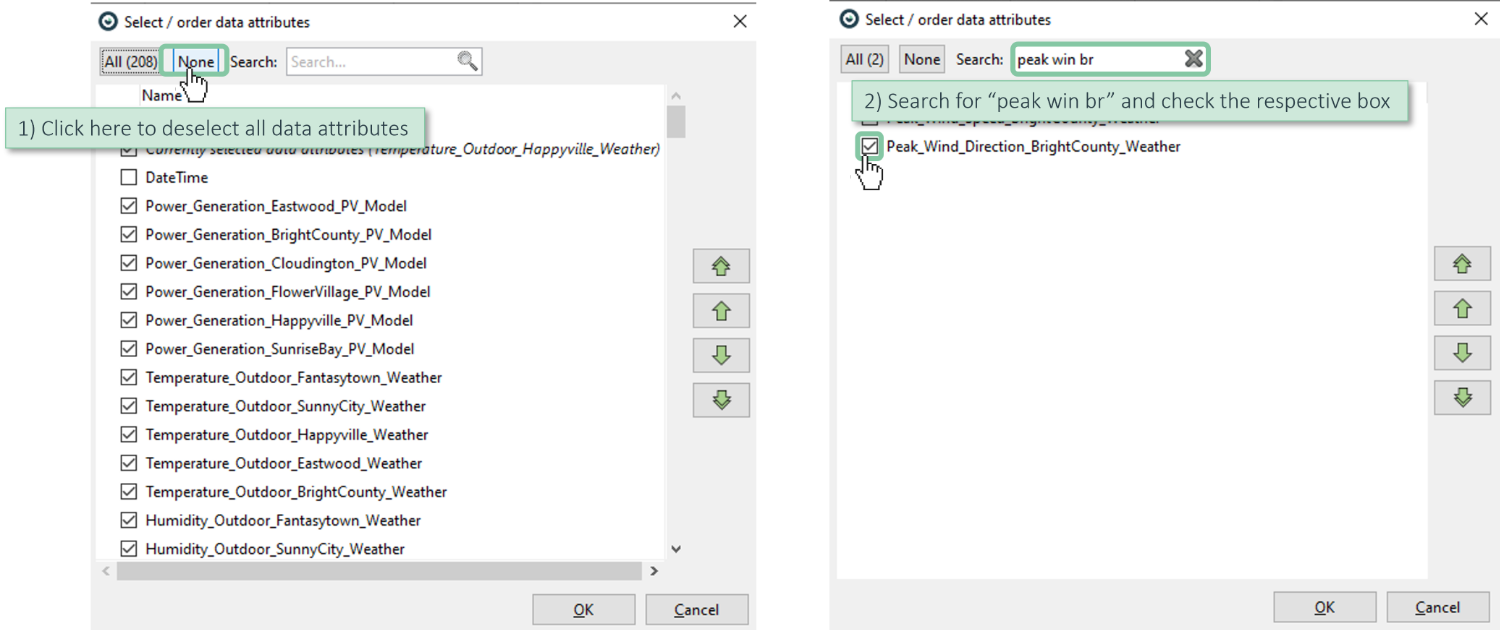
Open the "Table" view in the bottom right, and click on "Shown attributes".
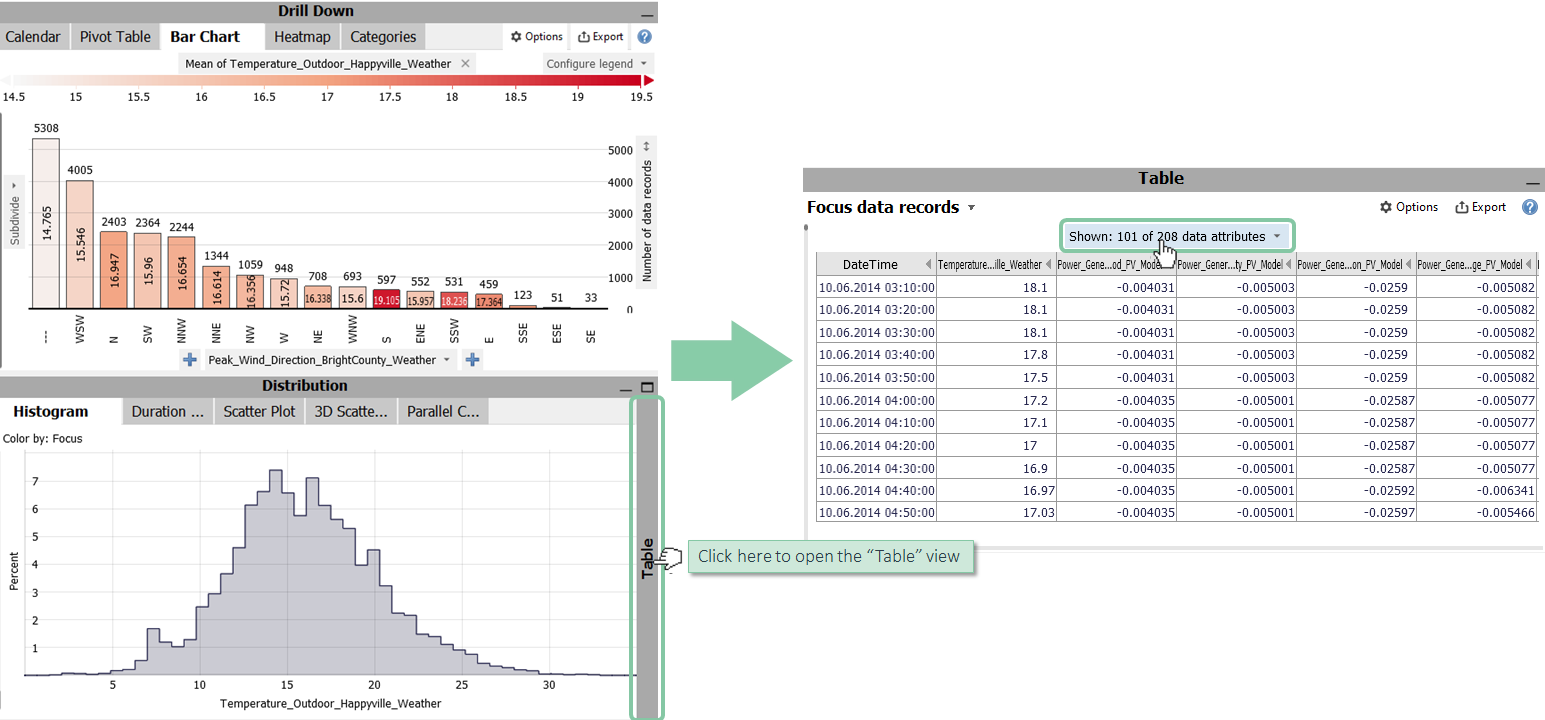
Click on "None" to deselect all data attributes, search for "peak win br" and select "Peak Wind Direction Bright County Weather" only.
Click the search icon above the column, and type "W".

Now we have selected all westwind-based directions.
Click the editing icon to start the editing mode.

Then, in the table view, above the column header, click the arrow icon, "Set to Value" and type "Western Winds".
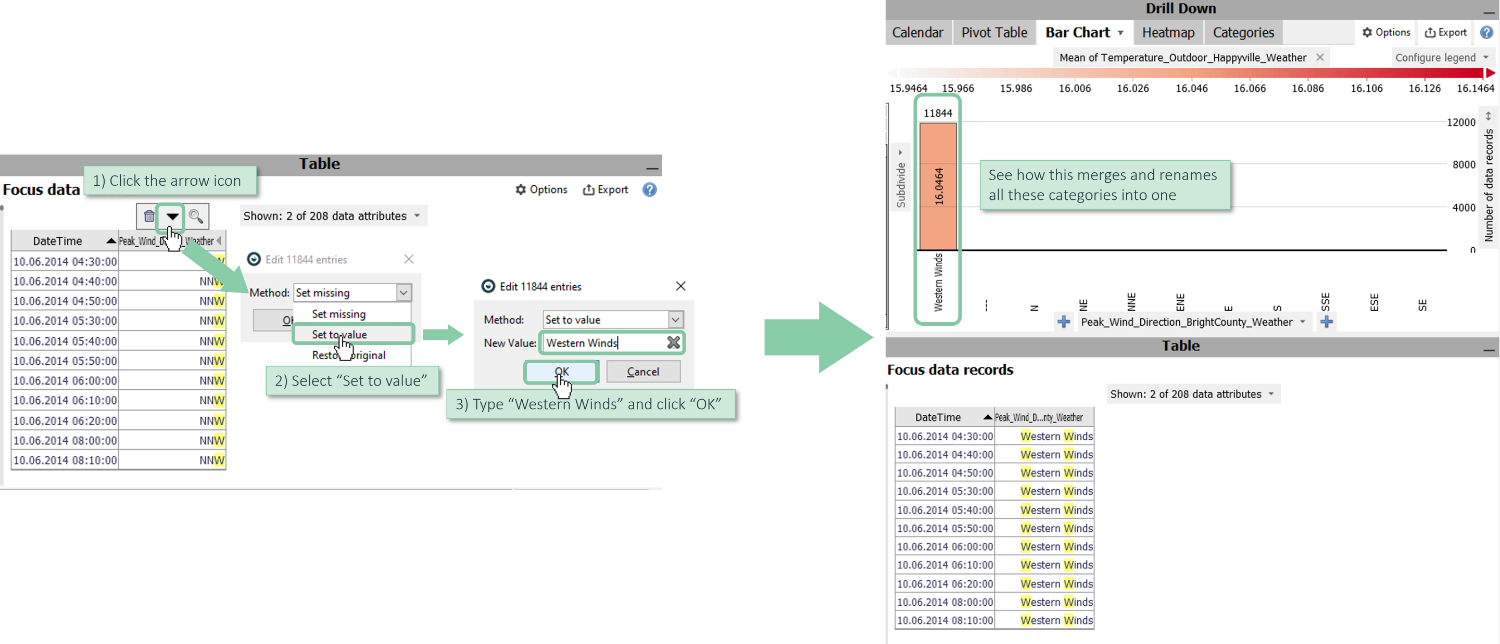
This renames (and effectively merges) all these categories into one category "Western Winds".
Note: to learn about exporting this cleaned categorical data attribute, please refer to the next section.
Exporting the edited data
After your edits have been made, you can export the cleaned data table.
Click "export" in the focus bar and choose one of the options for CSV or clipboard.

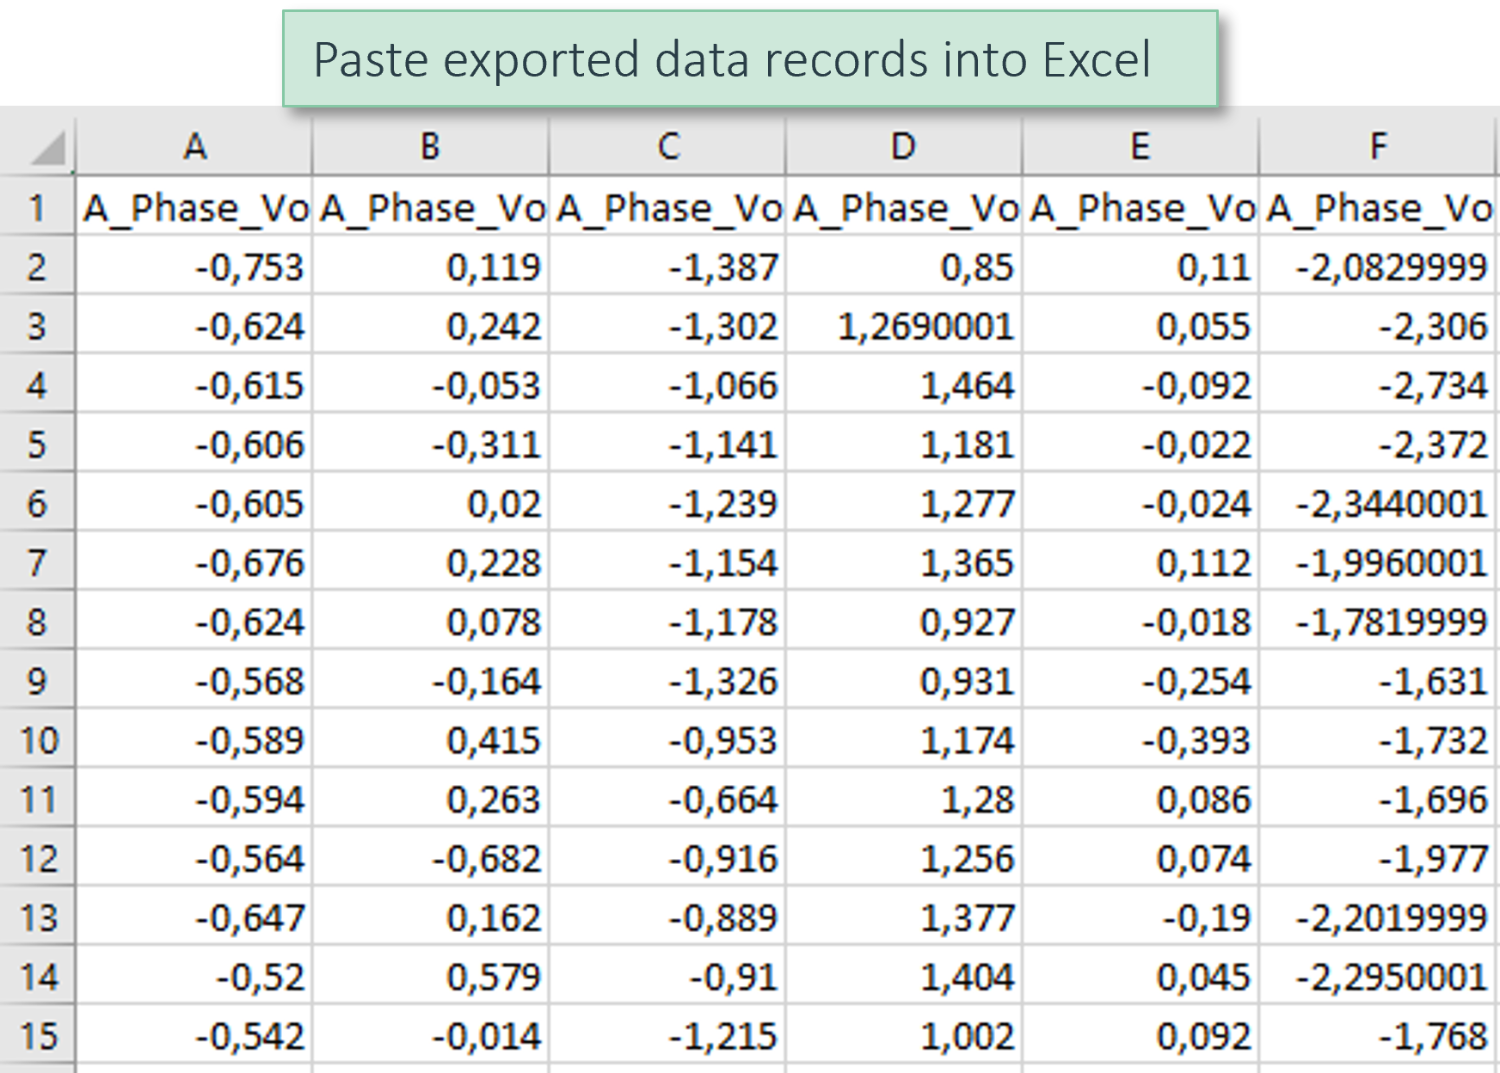
Paste exported data records into Excel with CTRL+V.
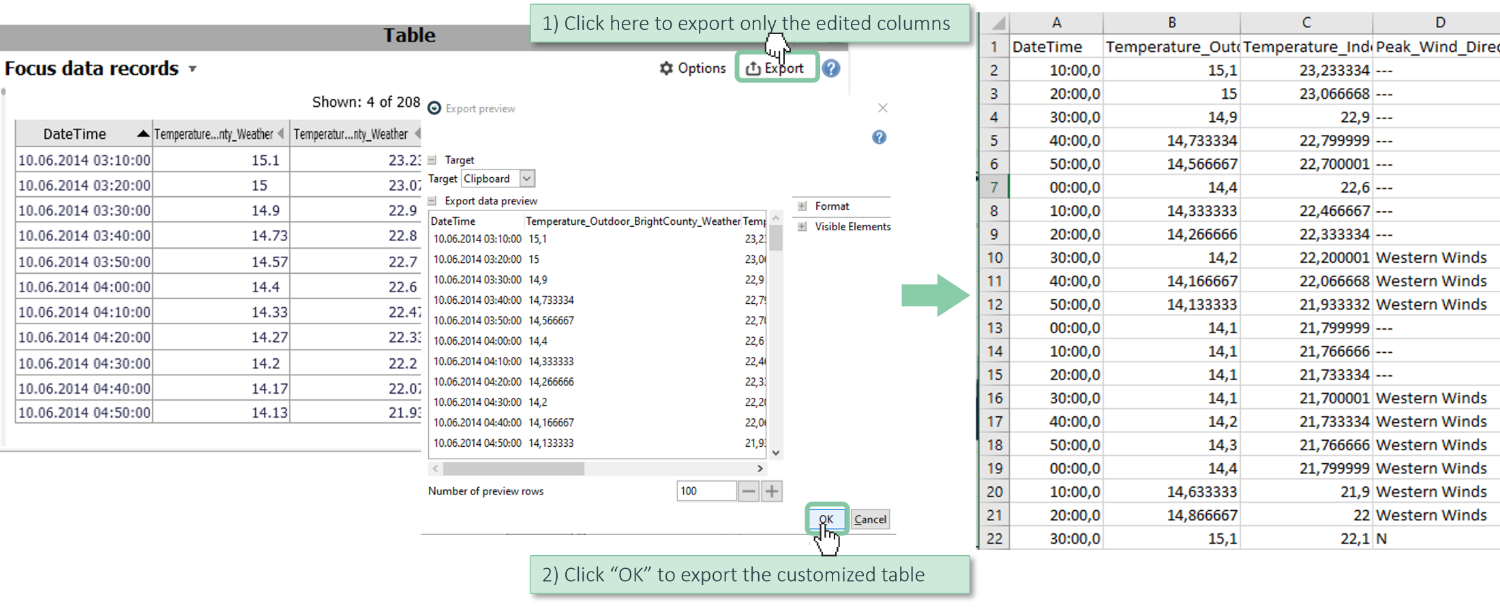
Click "Export" in the table view if you want to export only the edited columns.
Paste exported data records into Excel with CTRL+V.
Note: see more details in the step by step guide on exporting data.
Restoring the original values
All data edits made in this session of working with Visplore can be undone. A session in this context ends when you either close Visplore, load new data from a source, or load a .visplore file.
Select the set of variables and data records you would like to restore.
Note: Make sure, "Temperature_Outdoor_BrightCounty_Weather" and "Temperature_Indoor_BrightCounty_Weather" are selected (click their names or their checkmarks).
Note: Ensure, no data records are selected. In case a focus is defined, clear it by clicking the "x" near the word focus.
Click "cleanse" / "Restore original".
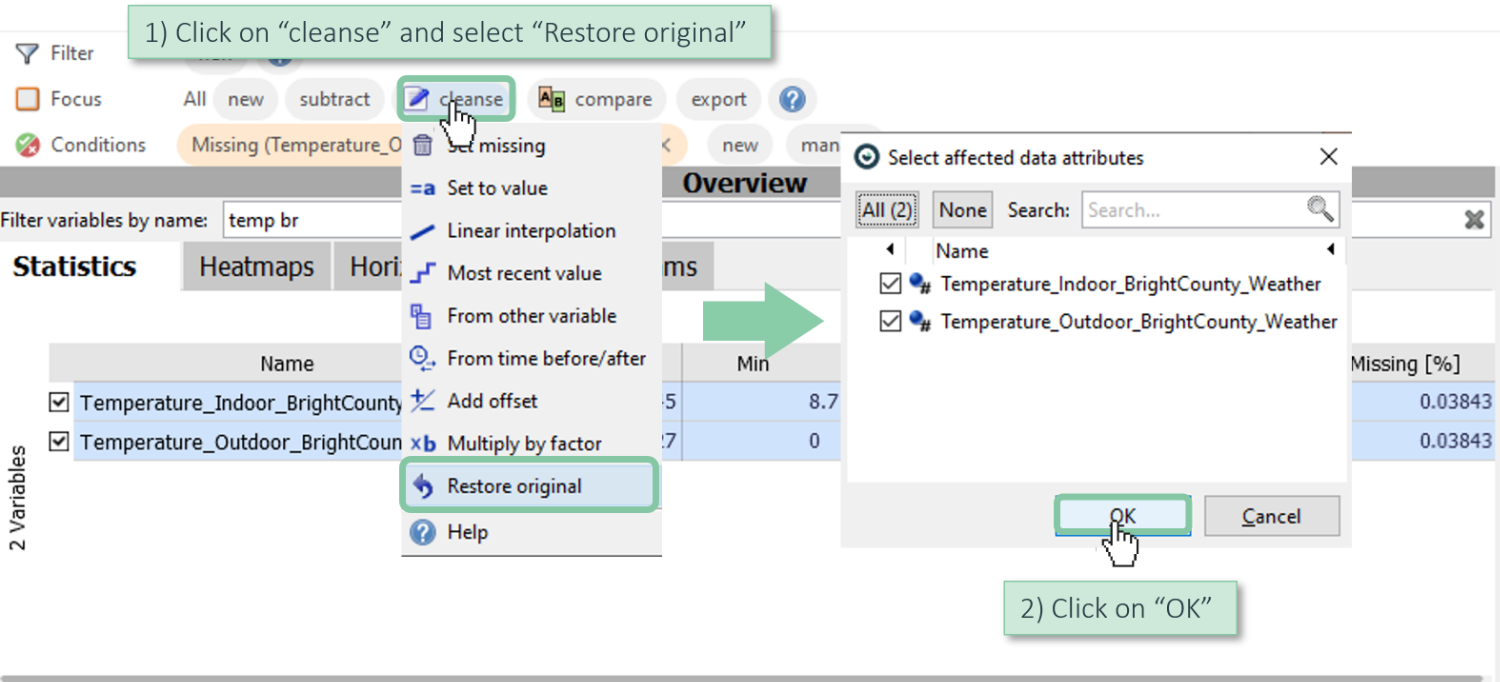
This has discarded all edits made to the respective data attributes in this session. Note how the outliers we had removed earlier are back.

Please note:
- if you had multiple variables selected, you will be asked, for which variables you would like to restore the selected records.
- if you had data records in Focus when clicking "Restore original", only edited values within the selected subset of records will be restored for the chosen attributes.
- edits made for categorical data can only be undone within the table view ("Focus data records"), see the previous section on editing and restoring categorical data.
List of Data editing operations
The following editing operations can be applied to values in Visplore:
- Set Missing: the selected values are discarded, and set to Missing. As a result, they are not used in computations, and not shown in visualizations.
- Set to value: the selected values are replaced by a user-specified constant value, e.g. zero.
- Linear interpolation: the selected values are replaced by linear interpolation from the nearest neighbour values that are not selected (neighbours regarding the time axis, if any, or table order otherwise). At borders, when only one neighbour exists, that value is repeated. A typical use-case is filling rather short gaps of a continuous sensor time series.
- Most recent value: the selected values are replaced by the constant value that was most recently observed before the selected values ("before" in the sense of the time axis). Can be used to fill gaps by repeating the previously observed value.
- From other variable: the selected values are replaced by the values of another, user-chosen variable at the same time. Optionally, the values can be re-scaled using manually specified minimum and maximum values, or automatically inferred from the local value distribution (Mean, Standard deviation) around the selected values. A typical use-case is filling longer gaps, where simpler methods like linear interpolation would fail.
- From time before/after: the selected values are replaced by the values that occured a user-specified period before or after the selected values. For example, one day or one week before. In case the period to fill is longer than the offset to read the values from, the copied pattern gets repeated. A typical use-case is filling longer gaps, where simpler methods like linear interpolation would fail.
- Add offset: Adds a constant value to each of the selected values.
- Multiply by factor: Multiplies each of the selected values with a constant factor.
- Restore original: Discards all modifications of the selected values made within this session and restores the original values (i.e. the values at the time of loading the data / the .visplore file) .
>> Continue with Next lesson: Computing new data attributes
License Statement for the Photovoltaic and Weather dataset used for Screenshots:
"Contains public sector information licensed under the Open Government Licence v3.0."
Source of Dataset (in its original form): https://data.london.gov.uk/dataset/photovoltaic--pv--solar-panel-energy-generation-data
License: UK Open Government Licence OGL 3: http://www.nationalarchives.gov.uk/doc/open-government-licence/version/3/
Dataset was modified (e.g. columns renamed) for easier communication of Visplore USPs.
