Workflow Features
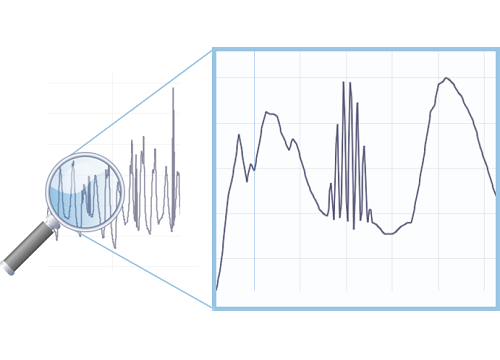
Working with real data can be quite a pain. Discover how Visplore speeds up your analytics of complex, unclean data by magnitudes.
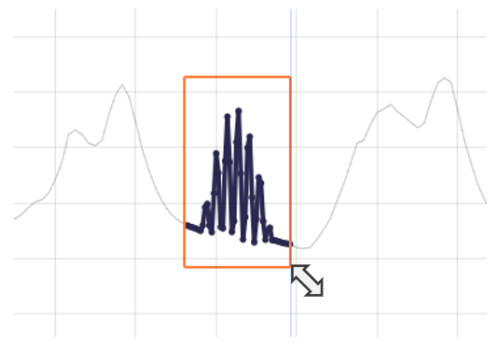
Select relevant patterns and categories of your data intuitively in the visualization as a graphical way to specify powerful queries.
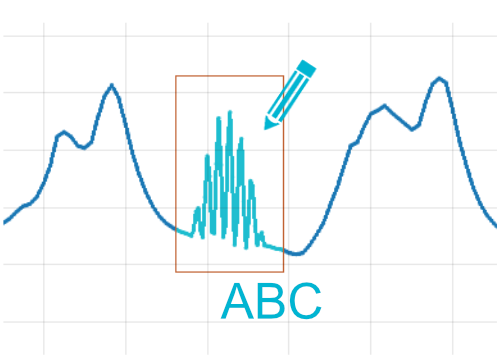
Annotate patterns and time periods with a click, for example as anomalies or training data, and export these labels for downstream analytics.
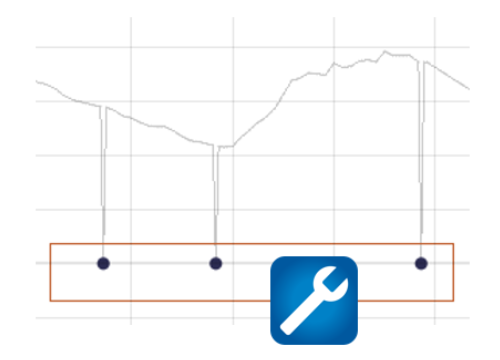
Resolve data problems interactively. For example, replace outlying values, interpolate data gaps, and rename misspelled categories with a click.
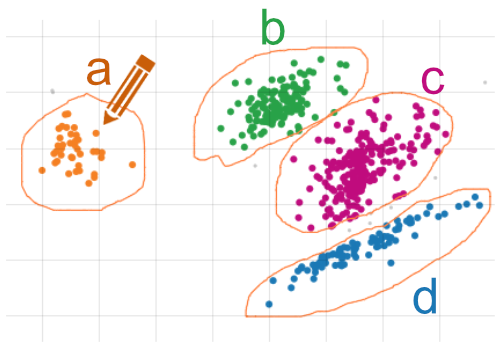
Define the data categories and segments that matter to you and use them in the analysis immediately. For example, time periods, value intervals, and clusters.
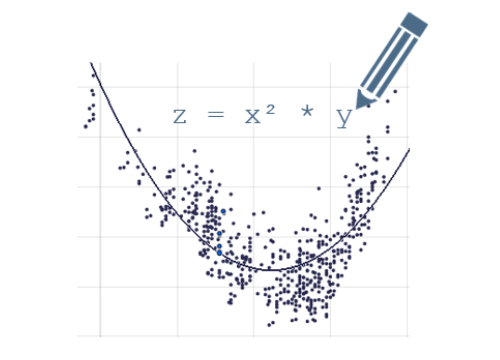
Use the integrated formula editor to compute new data attributes and tune their parameters any time, updating the visualization immediately.
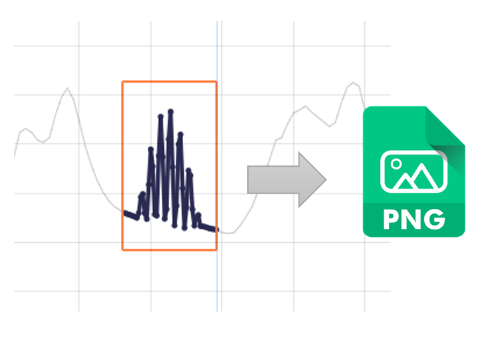
Export visualizations to a file or the clipboard with lots of customization options for adjusting details of the appearance.
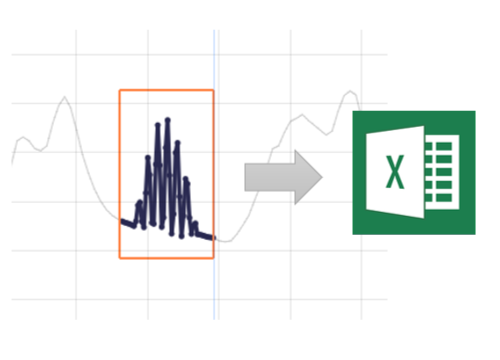
After interactive selection in the view, simply copy and paste selected data to Excel for further processing or reporting.

Save your analysis as self-contained files for sharing them with colleagues, or as templates for creating your own set of customized analysis cockpits (this feature is not available in Visplore Free).