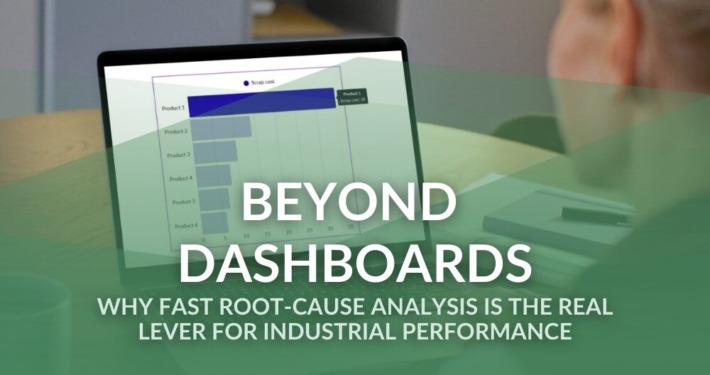
Plug and play time series analytics software
Your self-service tool for deep exploration and intuitive preparation
Simply load CSV files, connect to SQL databases, or the OSISoft PI system. Your reports in Visplore will automatically update for the latest data.
Or work tightly coupled with your Python notebooks, just as R and Matlab. An API makes sending data to Visplore as easy as reading back results. This combines the advantages of scripted and interactive analysis. You can even fully automate complex time series analytics as part of data pipelines.
For projects on industrial sensor data, the preparation and analysis of the data basis is a very time-consuming task. Industrial processes change repeatedly, sensors fail or drift.
Visplore instantly provides you with an overview of up to hundreds of sensor time series. It shows gaps and anomalies and lets you interactively define an optimal data basis. Intelligent tools compare time periods and reveal how and why industrial processes have changed.
Any AI is only as good as the labels it is trained on. But labeling industrial sensor patterns requires domain expertise and may get very costly.
Visplore makes labeling massive sensor data intuitive and easy for everyone. It’s the only tool for labeling up to thousands of machine operations interactively within minutes. Label data automatically or audit given labels manually. Finally, access the labels directly from your data science notebooks, or export them to files.
The impact of your project results depends on how they are presented. Static charts and tables are limited and often hide specifics of the underlying data.
Visplore lets you go beyond PDF and Powerpoint. Easily document the story your data tells as interactive reports. Let your clients zoom into charts, change filters, or investigate correlations between linked views. For more reproducible results, more value, and more satisfaction by the extra “wow”.
Most interactive analysis of 10+ millions of data samples
Unique dynamic visualization methods for big time series data
Local or on premise – no need to move your data to the cloud
Master exploration, cleaning, labeling and much more with our tutorial videos
Pre-configured analytics tools for fastest time-to-insight
From small to enterprise: Scale according to your needs
Partnering with OSIsoft
This blog announces the partnership of Visplore with OSIsoft (part of AVEVA) and explains how Visplore adds value to your PI System.
How to label time series efficiently – and boost your AI
Webinar from Sept 30: Learn how AI projects benefit from high-quality labels for time series data, and how Visplore significantly speeds up the labeling process.
Benefits of Data Exploration
The goal of data exploration is to learn about characteristics and potential problems of a data set without the need to formulate assumptions about the data beforehand.