Self-service analytics and advanced condition monitoring – at more flexible licensing

Visplore accelerates troubleshooting, root-cause analysis, and performance monitoring.
Easy to learn, fast to use, and built for complex processes. Fully on-premise with flexible licensing to suit your team.


 

Why our customers prefer Visplore

 
voestalpine

Important Insights

“Visplore enables our process engineers to analyze data from our Aveva PI Systems deeper. This provides important insights and supports more and more Mondi Sites in continuous process optimization tasks.”

Wolfgang Meyer
Head of Production Solutions,
Mondi AG

From days to 5 minutes

“With Visplore, we reduced the time for analyzing years of data from days to 5 minutes”

Thomas Reiterer
Head of Material Testing Leoben,
RHI Magnesita

What makes Visplore your better choice

Made for discoveries

  • Seamless integration to historians, databases, files

  • Pre-configured multi-chart analysis

  • Graphical querying and filtering

  • High performance: Instant results on interaction

  • 20+ visualization types

  • Pattern search and multivariate regression

  • Correlate 1000+ pattern profiles with KPIs

Lightweight deployment and pricing

  • On-premise flexibility

  • No cloud-first policy

  • All new features available on-premise

  • Lower entry costs – start small and scale as needed

  • Granular pricing based on number of users

  • Interactive sharing without extra licenses

  • No persistent data duplication, connect to any existing source

  • Features
  • On-Premise availability
  • Ease of use (no coding)
  • Flexible pricing
  • Seamless data integration
  • Plug-and-Play integration
  • Visplore
  • Typical alternatives (Seeq, TrendMiner, etc.)
  • Limited
  • Often requires expertise
  • Fixed/High costs
  • Complex or customer setup
  • Often requires cloud

Use cases for real value

Fast and easy root-cause-analysis across your data sources

Visplore transforms root-cause analysis into a simple, intuitive process. Analyze multiple variables and uncover hidden correlations with just a few clicks. Pre-configured charts and intelligent visualizations make complex troubleshooting effortless, leading to greater process stability and reduced downtime.

„Identifying causes of process instability is now a matter of minutes rather than days“

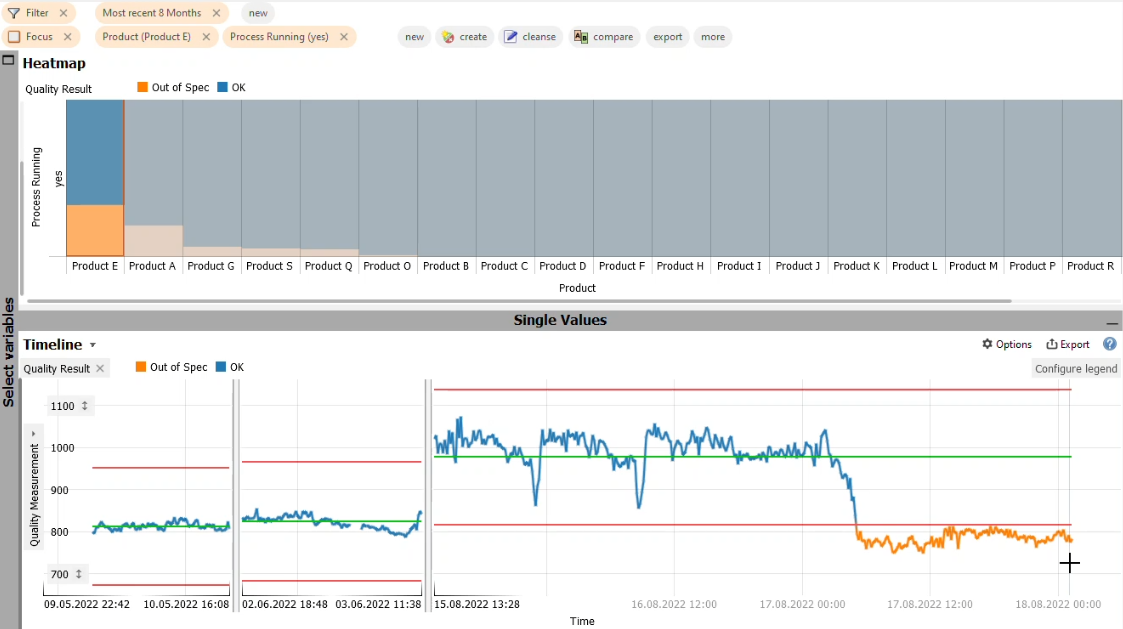
Process stability analytics across your products and operation modes

Handle variability in processes with tools designed for transparency and speed. Multivariate views of parameters, KPIs, and process conditions enable quick comparisons and deeper insights. Save hours on analysis, reduce inefficiencies, and drive continuous improvement.

„Insights from process variation enabled 7% cost savings in material composition, at the same rate of in-spec production”

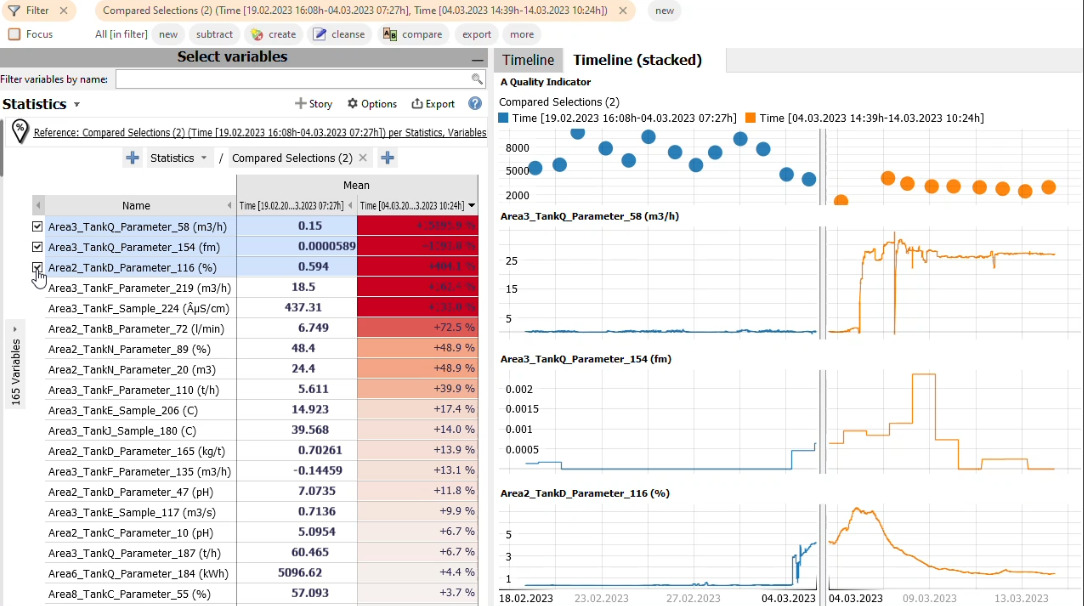
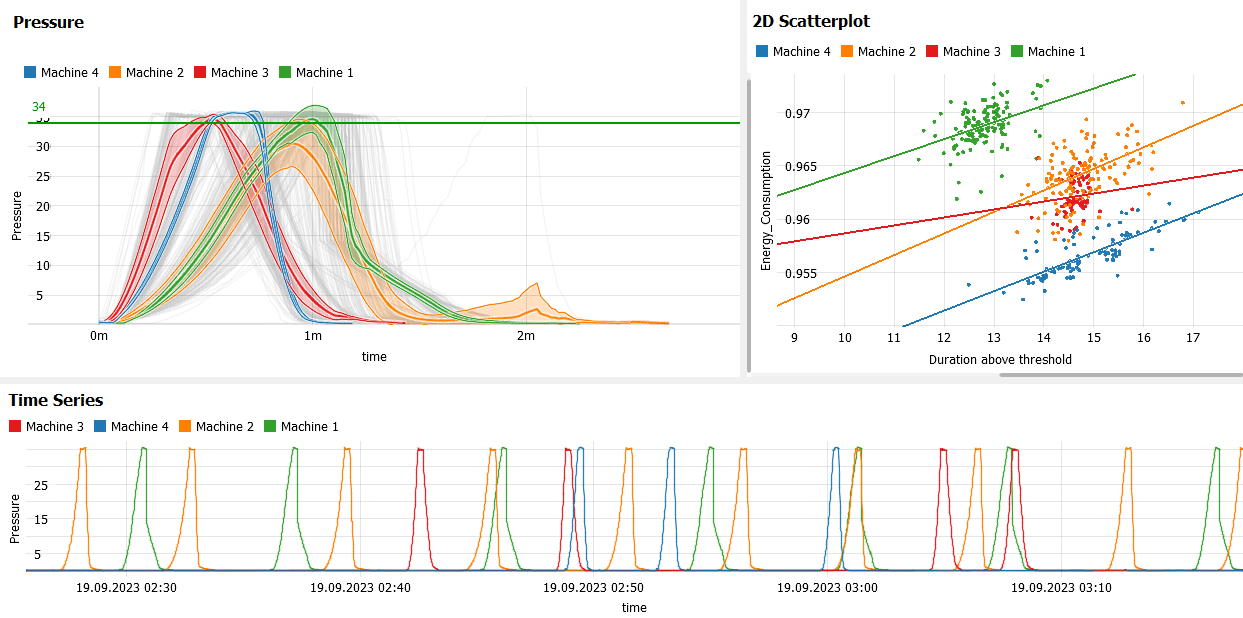
Asset comparison for in-depth performance and incident analytics

Asset comparison for in-depth performance and incident analytics

Visplore simplifies monitoring critical conditions across multiple assets—pumps, boilers, heat exchangers, and more. Compare performance metrics, energy efficiency, and impact on product quality seamlessly, ensuring optimal reliability and cost savings.

„Direct comparison of machine operation across plants has saved 400,000 EUR of energy costs per plant, per year “

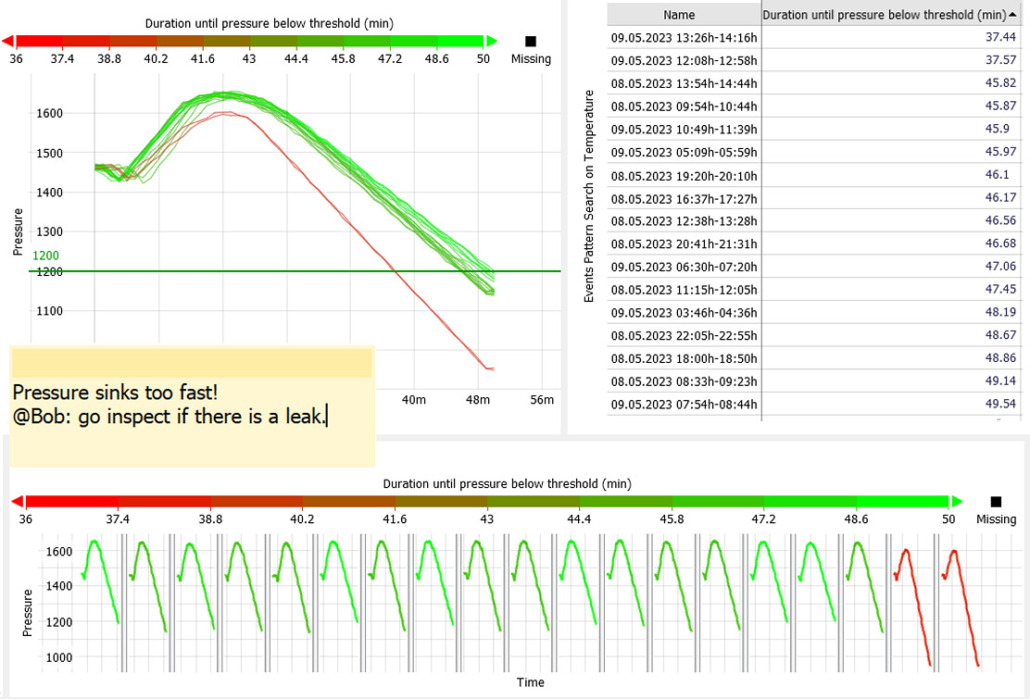
Flexible ramp-up and batch analysis

Easily isolate patterns like ramp-ups and batch operations, identify anomalies, and correlate KPIs with contextual data. Define benchmarks for optimal performance and detect variabilities impacting yield and downtime.

We spotted a boiler leak days earlier by comparing downramp profiles in Visplore“

Boiler Leak, pressure sinks too fast, go inspect if there is a leak

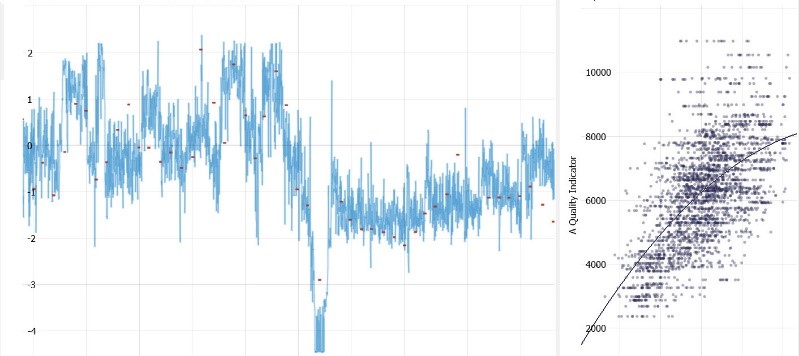
Instant correlation and predictive modeling of process and quality data

Integrate data from historians, files, and ERP systems in minutes. Visplore empowers engineers to model quality predictions without coding expertise. Understand process variations and their impact on quality and efficiency to continuously improve OEE.

Your best RoI ever

  • Start small and grow with user demand – always without limits in data volume
  • Lean start price that includes all features and connectors, independent of production volume
  • Boost productivity for process engineers, operators, and maintenance departments worth thousands of working hours per year
  • Engineers make discoveries worth millions of EUR/USD in saved asset maintenance cost and process optimization
  • Increase your OEE by more production within specification and rapid root-cause analysis
  • Shorten project cycles
  • Save costs for external analytic service providers
  • Add value from existing investments in digital transformation
  • Get full transparency for data-driven decisions and process optimization
  • On premise-installation, no data has to leave your sites
  • and much more …

Plug and Play for your data landscape

 
osisoft pi
influx
oracle
sql server
postgre sql
databricks
python
Mathworks