From Thousands of Quality Trends to Instant Transparency

How quality teams at RHI Magnesita use Visplore to focus on solving problems rather than searching for them

Problem: Maintaining Quality Oversight at Scale

RHI Magnesita, world-leader in refractories, operates many production sites worldwide and produces a wide range of refractory products. Each product is associated with numerous quality characteristics, which results in thousands of individual trends that need to be monitored.

Quality teams must detect developments such as increasing non-conformities, declining CpK values, systematic deviations from setpoints, or unusual outliers. Traditional SPC approaches require engineers to manually inspect large numbers of individual charts, making it a challenge to see where attention is actually needed.

Measurement frequencies also vary significantly across the different products. In such a complex environment, emerging quality problems can remain unnoticed for too long, potentially leading to scrap, rework, production inefficiencies, or customer complaints.

Solution: Quality Analytics with Visplore

To address this challenge, RHI Magnesita uses Visplore quality analytics templates that automatically retrieve quality data from the company’s data warehouse — covering years of data up to today.
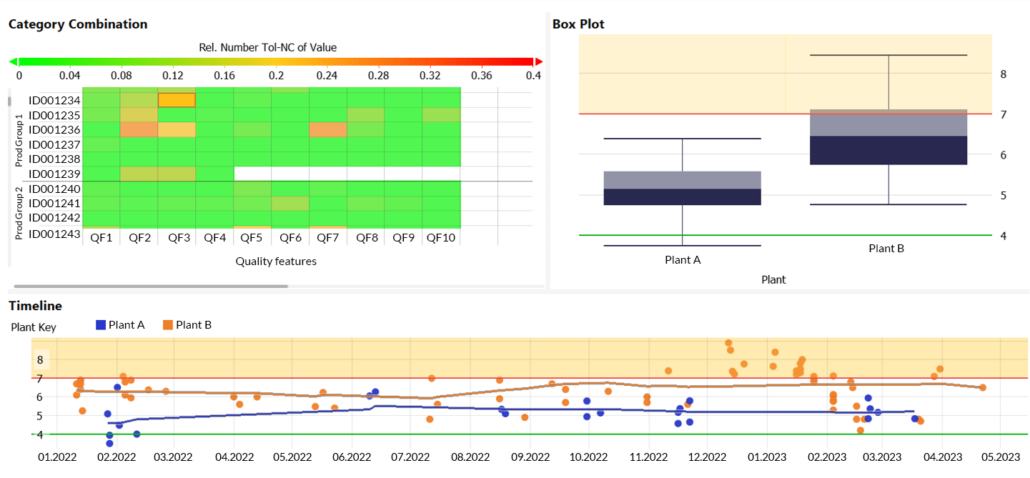
  • Instant overview: Visplore highlights issues such as non-conformity clusters, systematic deviations, outliers, or negative trends, even across thousands of combinations of products, quality characteristics, plants, and formats.

  • Interactive SPC-style charts: From this overview, users can instantly drill down to details to see trends and validate KPIs.

  • Easy selection and filtering: Individual measurements can be selected graphically in the visualization to inspect details, analyze production contexts, or exclude outliers from the analysis, also automatically.

  • Instant comparison: Manufacturing orders, products, and plants can be compared instantly using statistics and visualizations such as histograms, box plots, or heatmaps.

  • Automated reporting: Quality analyses can be exported as standardized PDF reports, also automatically once per day via e-mail.

“Visplore allows us to quickly see where quality issues might be emerging across our production. It has greatly improved the way we monitor our quality data.”

A heatmap highlights combinations of quality inspection characteristics and products with high non-conformity rates. Selecting a cell shows comparisons across plants and corresponding trends.

Result: Faster Insights for Fewer Quality-related Losses

Today, dozens of quality professionals worldwide use Visplore to monitor production quality. Instead of manually reviewing thousands of SPC charts, engineers can now immediately identify where potential quality issues are emerging and investigate them interactively.

This creates significantly greater transparency across plants and products while reducing the time required for routine quality monitoring. Quality teams react earlier, investigate faster, and focus their efforts where it matters most.

→ Quality teams can focus on solving problems rather than searching for them.

Highlights

  • Earlier detection of quality risks helps prevent costly scrap, customer complaints, and rework — identifying issues earlier can reduce quality-related losses by 10–20%.

  • Global transparency enables teams to detect emerging problems within minutes instead of hours, accelerating corrective actions across plants.

  • Up to 50–80% less time spent on routine quality monitoring, allowing quality engineers to focus on root cause analysis and continuous improvement rather than manually reviewing SPC charts.

  • Earlier detection of quality risks helps prevent costly scrap, customer complaints, and rework — identifying issues earlier can reduce quality-related losses by 10–20%.

  • Global transparency enables teams to detect emerging problems within minutes instead of hours, accelerating corrective actions across plants.

  • Up to 50–80% less time spent on routine quality monitoring, allowing quality engineers to focus on root cause analysis and continuous improvement rather than manually reviewing SPC charts.

Seeing is understanding. Request your personal demo to see Visplore in action!

You may also be interested in…

How Luminus reduces downtimes by locating CCGT boiler leaks from shutdown events. [Read more]

How Hafslund Eco cut Francis turbine maintenance downtime by 50%, avoiding €1.1 M revenue loss.

How Hafslund cut turbine maintenance downtime by 50%, avoiding €1.1 M revenue loss. [Read more]