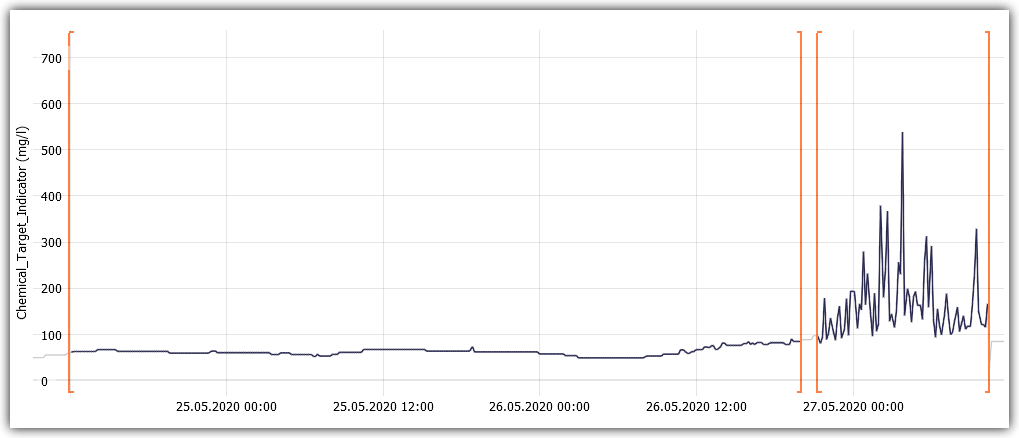
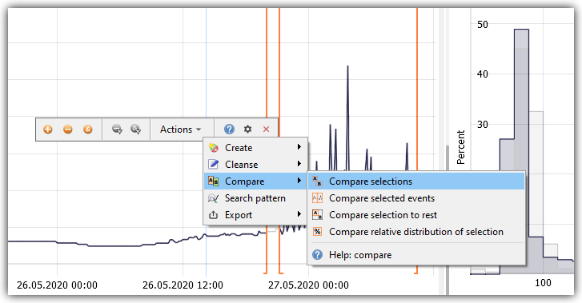
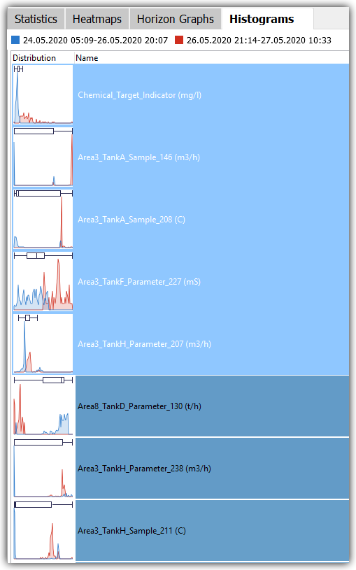
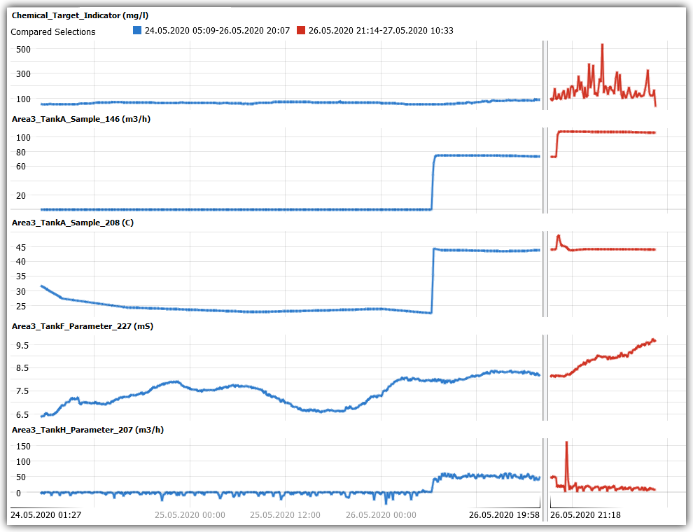
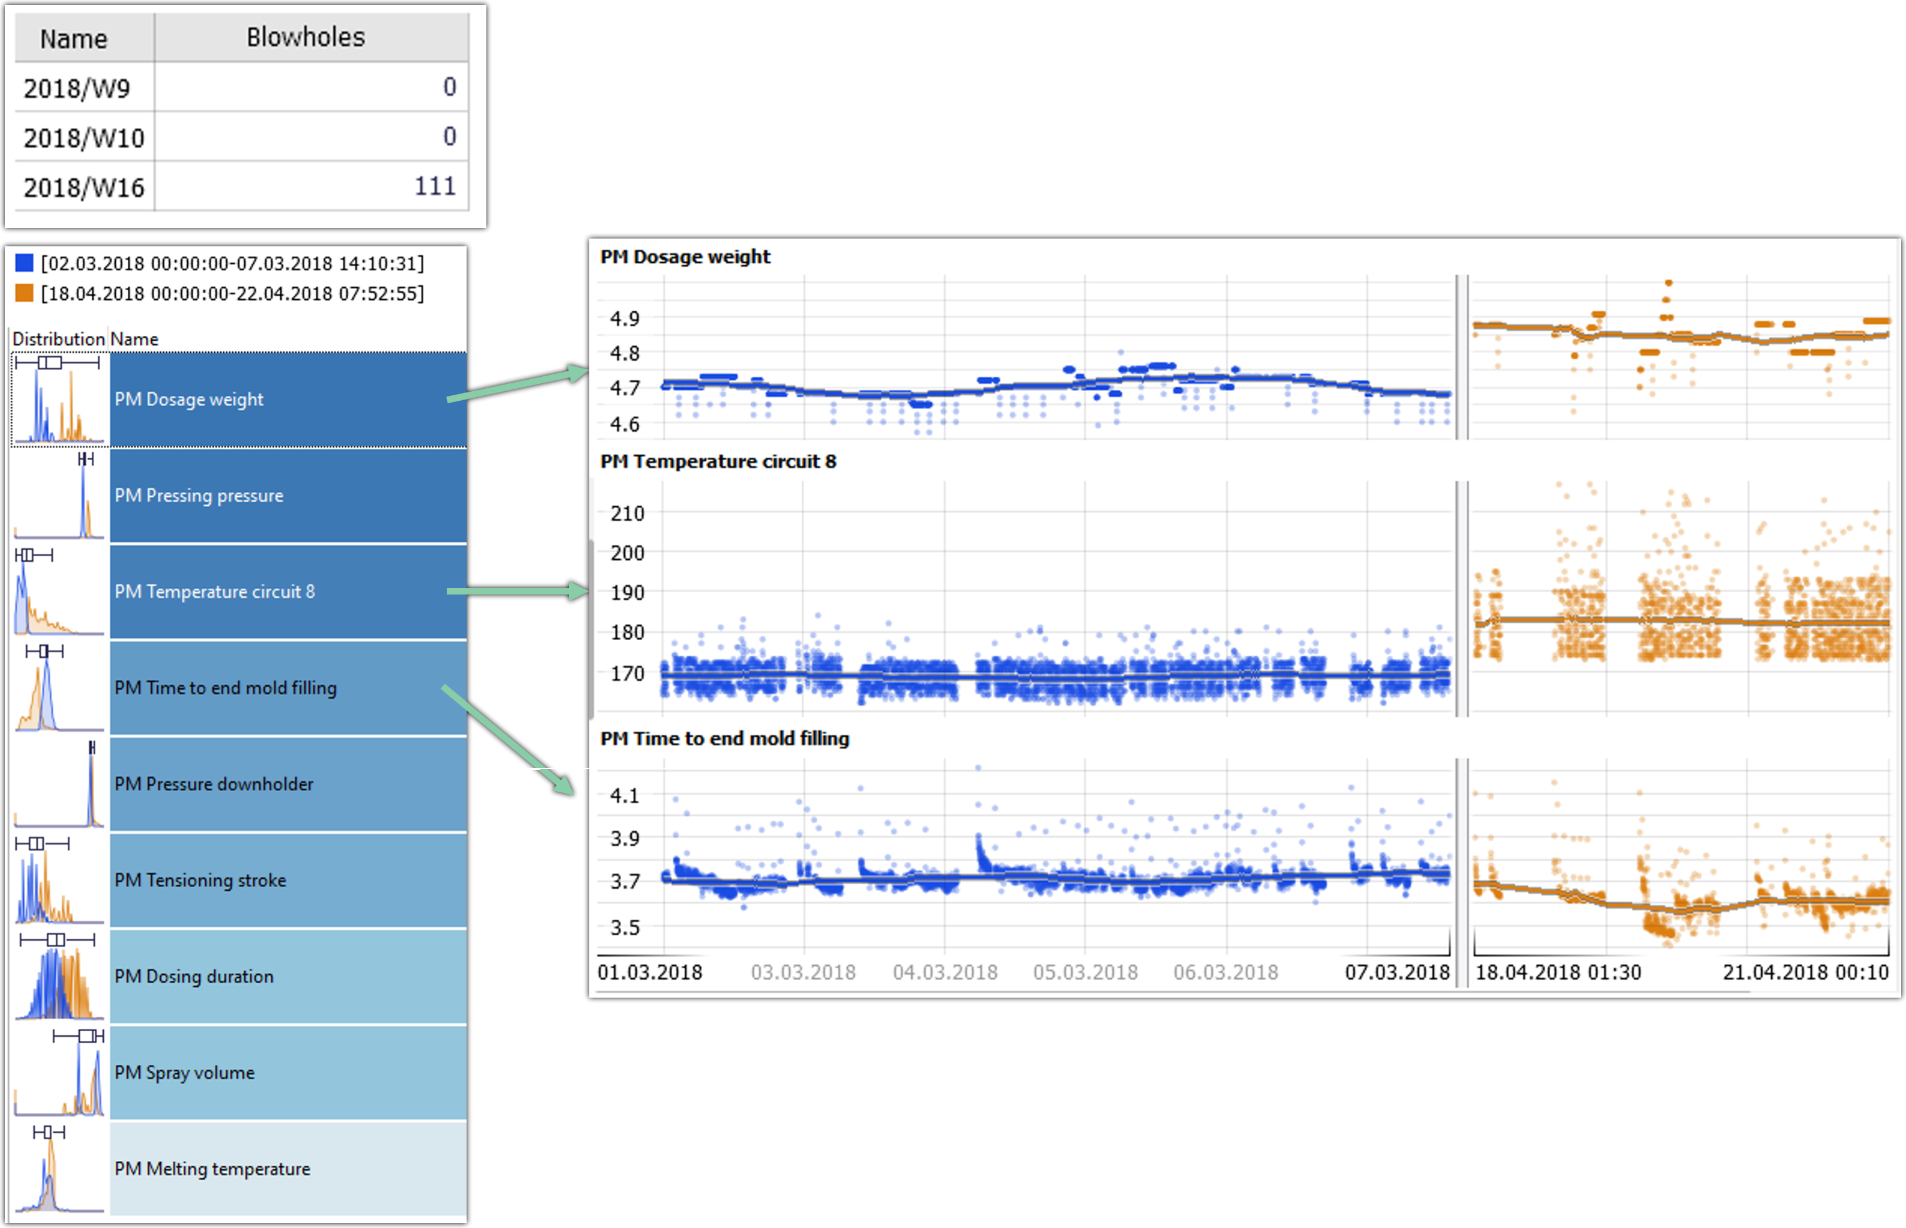
The figure shows that the number of blowholes, a specific reason for scrap, increased significantly from 0 to 111 for calendar week 16 compared to a few weeks before. Step 1 of the workflow is to select the time periods that should be compared. In this case, these are times with no and with high scrap rates, respectively. After using the feature “Compare selections” (step 2, not illustrated), the identification of deviations in process parameters (step 3) is now simply based on ordering all process parameters by differences in their value distribution for the two compared time periods. This overview already shows that Dosage Weight, Temperature in circuit 8, and some other process parameters have different levels. The detailed analysis (step 4) shows for three process parameters how they changed over time. For example, the Dosage Weight and the Temperature in circuit 8 were increased by the operator while the timing for filling the mold was decreased. Within seconds, process technologists get insights that enable them to derive measures to effectively mitigate scrap.

