The fastest tool for labeling and exploring time series data

For faster project progress and better data quality

Visplore is a versatile tool for boosting data science in manufacturing and power supply. Interactive, transparent, well-integrated in your workflow.

Watch the product tour
(4 min)


From data to sharable insights within minutes

Integrate

Break up data silos and combine historians, databases, files.

Explore

Assess your data quality and discover insights within minutes.

Prepare

Correct outliers, filter irrelevant data, and label patterns on the fly.

Share

Create and share interactive data presentations with your colleagues and customers.

Why our customers prefer Visplore

  • 1.1 million EUR saved

    "Pattern anomaly detection and fast correlation with contextual data empowers the engineers to make data-driven decisions that save millions of EUR."

    Thor Arne Hvam Bruun Turbine specialist,
    Hafslund Eco
    Read more
  • Important insights

    "Visplore enables our process engineers to analyze data from our Aveva PI systems deeper. This provides important insights and supports more and more Mondi Sites in continuous process optimization tasks."

    Wolfgang Meyer Head of Production Solutions,
    Mondi AG
  • Much easier investigation

    "Visplore allows for a much easier investigation of relevant patterns and structures. Our downstream analysis becomes more efficient and we gain more confidence in the results."

    Dr. Denis Parganlija Main Data Scientist,
    Verbund AG
    Read more
  • €10.000 savings per project

    "Visplore saves us approximately €10,000 of cost per project for data preparation effort and is essential in analyzing the data of the physical processes."

    Dr. Josef Petek Manager Commercial Operations,
    Enexsa GmbH
  • From days to 5 minutes

    "With Visplore, we reduced the time for analyzing years of data from days to 5 minutes."

    Thomas Reiterer Head of Material Testing Leoben,
    RHI Magnesita
  • 33% less time

    "Visplore has greatly improved our data labeling process by providing a user-friendly interface that allows for quick analysis and standardization. The interactive features have made the labeling process more efficient, enabling us to label data in 33% less time."

    Florian Hinterbrandner Data Scientist,
    DRÄXLMAIER Group
  • Efficient labeling for AI

    "Visplore’s fast interactive capabilities provide us with a highly efficient way to analyse and label multivariate sensor data for AI applications."

    Johann Strasser Data Scientist, Palfinger AG
  • Major added value

    "The high performance of Visplore and its coupling with scripting languages is a major added value for us."

    Bernd Windholz Research Engineer, Center for Energy, AIT - Austrian Institute of Technology GmbH
  • Much faster preparation

    "By using Visplore, data preparation is many times faster and the prepared data is of higher quality than with the previously used, self-written tools."

    Prof. Dr. Thomas Kienberger Head of NEFI_Lab / Montanuniversität Leoben
  • Saves much time

    "Visplore saves us much time thanks to its user-friendly interface and covers many of our analytics needs without programming."

    Dr. Norbert Walchhofer, MSc Data Scientist & Co-Founder,
    Cognify GmbH
 
Verbund
Tenaga Nasional
mondi
illwerkevkw
GF
KTM Sportmotorcycles
AIT - Austrian Institute of Technology

Use cases

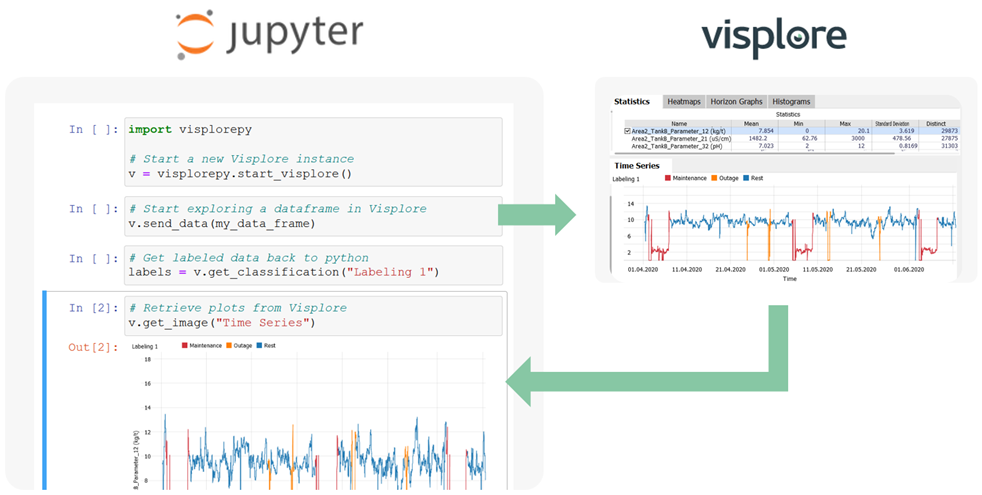
Python & Visplore for data preparation

Visplore enhances initial data science project phases with agile exploration and preparation, while Python offers flexible data transformation and operational code deployment.

Phyton and Visplore

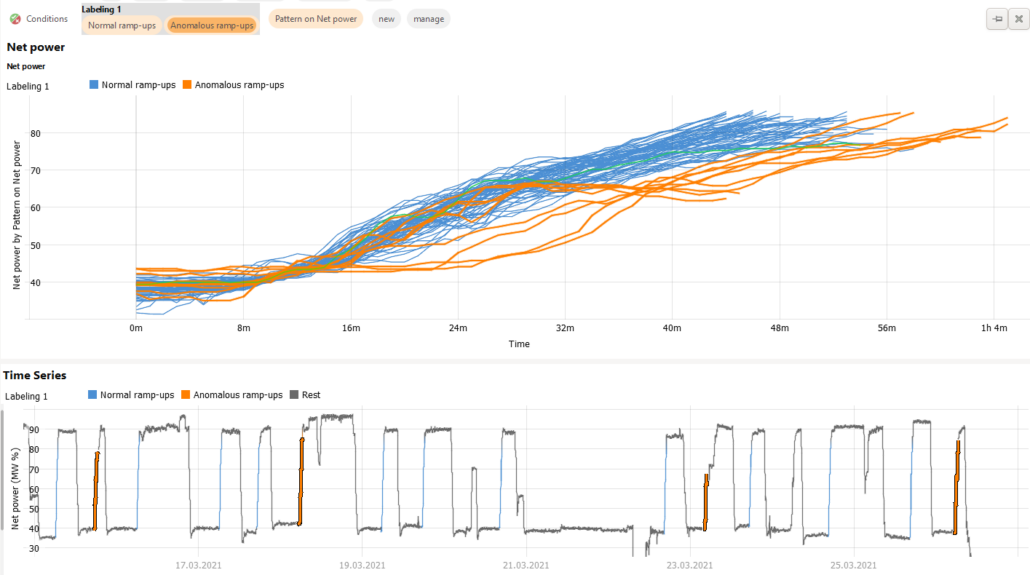
Label patterns in time series data for boosting your AI

Label patterns in time series data for boosting your AI

Select and label large multivariate datasets, define labels with formulas or scripts, mark data directly in visualizations, and use pattern search to label occurrences efficiently.

Extract recurring patterns such as process operations from sensor time series via pattern search or based on rules. Visplore lets you or your subject-matter experts label groups of operations intuitively in one click using visual query tools. Finally export or retrieve labels via an API.

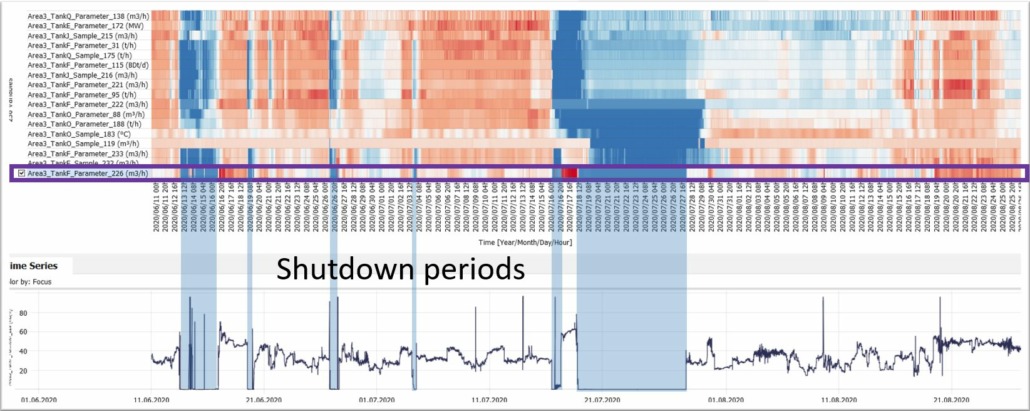
Find data quality issues, correlations, anomalies and discuss them with your clients

Visplore enables interactive exploration of massive time series data. Quickly select and compare patterns, identify correlations, explain anomalies, build regression models, and more, all in real-time. Its speed and ease of use allow you to discuss findings live with clients and experts, saving hours of meetings and ensuring a well-understood data foundation for your project.

“The visualization is fast and simple enough for live collaboration with the customers, on site.”

Head of Research in Industrial Data Science, R&D Research Institute

Deep diagnostics for troubleshooting your models

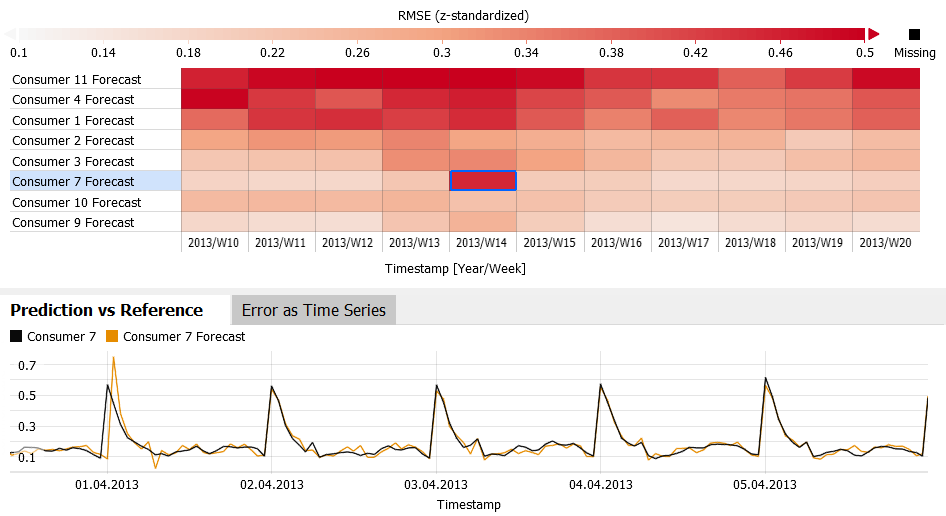
Efficient Forecast Diagnostics with Visplore

Monitor large number of forecast models with minimal effort and detect negative trends in forecast quality early on.

“Visplore is in use as a central strategic software for data analytics. The intuitive  diagnostics have allowed us to increase the quality of our forecasts significantly.”

Hermann Mehl, Renewable Energy Coordinator, Austrian Power Grid

Integration and preparation

Break up data silos by merging data from PI, SQL databases and various files types. Align time rasters, and include assets, quality samples, batch event frames or ERP data in your correlation. All interactively and without coding!

Any analysis can update as new data arrives – for condition monitoring or live reports. With our Python APIs, you can add own data sources, such as legacy databases or custom files. And fully automate workflows for alerting, reporting or result writeback.

Break up data silos by merging data from PI, SQL databases and various files types. Align time rasters, and include assets, quality samples, batch event frames or ERP data in your correlation. All interactively and without coding! Any analysis can update as new data arrives – for condition monitoring or live reports. With our Python APIs, you can add own data sources, such as legacy databases or custom files. And fully automate workflows for alerting, reporting or result writeback.

Your best RoI ever

  • FASTER PROJECT PROGRESS

    Reduces initial data analysis time, enabling quicker iterations toward deep insights and better models, and minimizing rework due to incorrect data.

  • BETTER DATA QUALITY

    Get more accurate and consistent labeling of data for training high-quality AI models.

  • ENHANCED COLLABORATION

    Involve stakeholders more efficiently, fostering better understanding and streamline the workflow among team members.

  • FAST TIME-TO-DEPLOYMENT

    Develop and deploy models more quickly, and meet challenging accurracy requirements by agile in-depth diagnostics.

  • ENHANCED DECISION-MAKING

    Get immediate insights for more informed decision-making across the organization.

  • And much more…

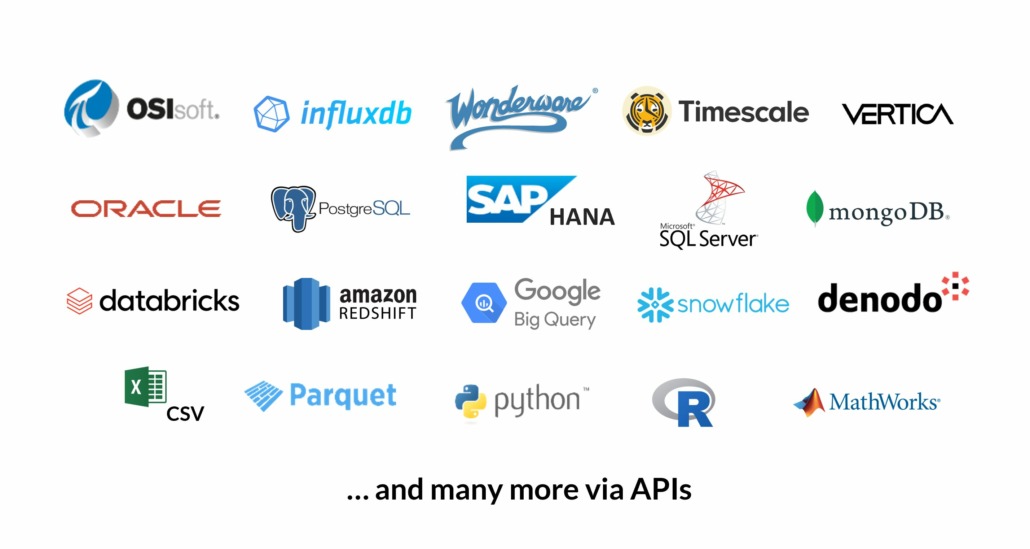
Plug and Play for your data landscape

 
osisoft pi
influx
oracle
sql server
databricks
python
postgre sql