Data integration
Getting your data in the right shape is key to any analysis. Discover how Visplore connects and aligns data from historians, databases, files and much more.
Access tags and assets from the PI data archive and PI asset framework. Define scalable analytics across assets. Update the analyzed data live in real time.
Access time series data from your databases and rasterize to the needed level of detail
Browse database tables and define ad-hoc filters, or set up custom filter masks for accessing data regularly.
Connect to data lakes and ETL systems via ODBC, to harness existing integration pipelines into your analysis.
Import CSV files with lots of flexibility for robust import, also many files at once. Or load big datasets as compressed Parquet files natively.
Use Visplore and data science environments simultaneously, to automate Visplore and transfer data in both directions.
For all other sources, you can add own connectors using Python under the hood. The user does not see Python, but an easy-to-use interface.
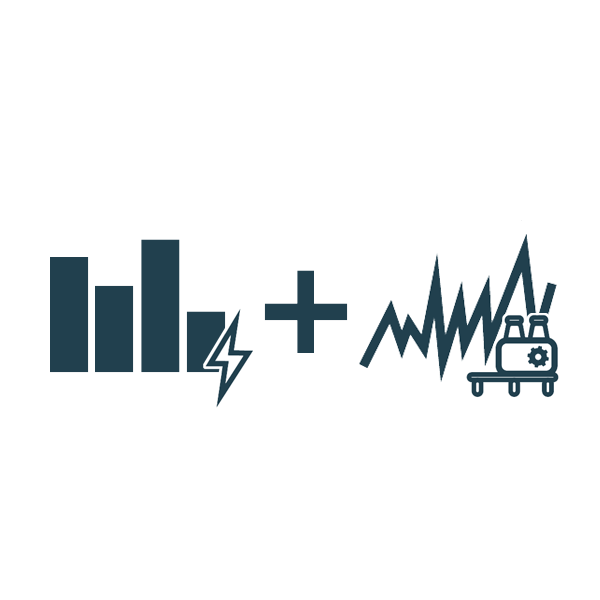
Power consumption in 15min intervals, high-frequency sensor data from machines, and irregular alarm messages? Visplore aligns them all!
Establish correlations between process parameters and quality indicators within minutes, considering different products, suppliers, and much more.
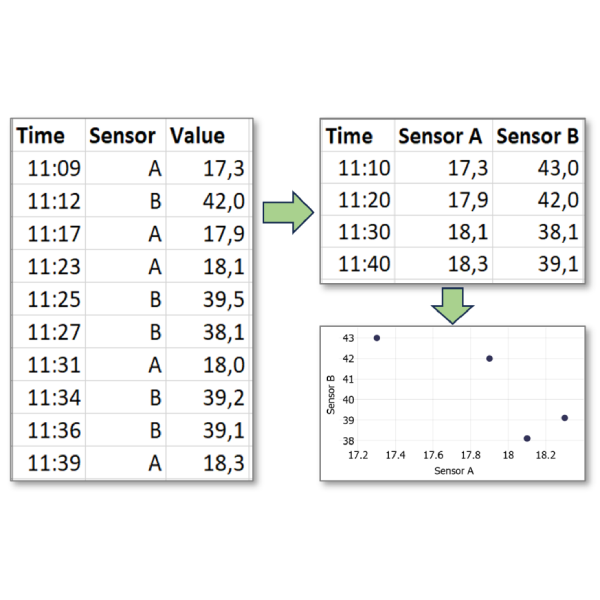
Bring typical time series / IoT data formats to an optimal structure for correlation and comparing assets.
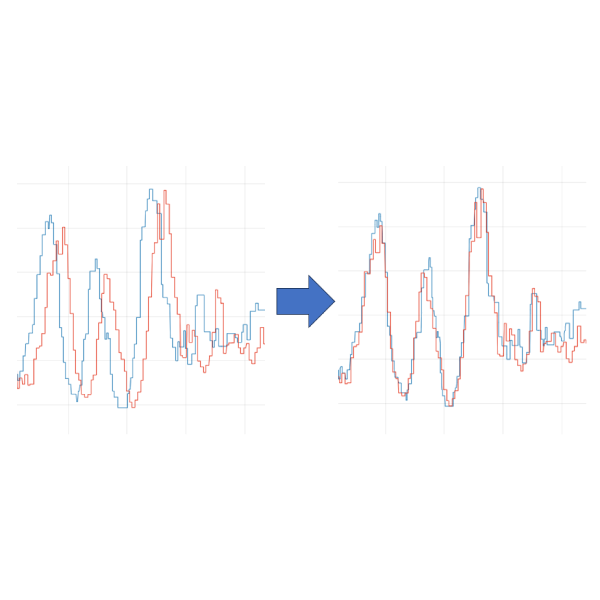
Compensate delays along the production process for root-cause analysis and predictive modeling.
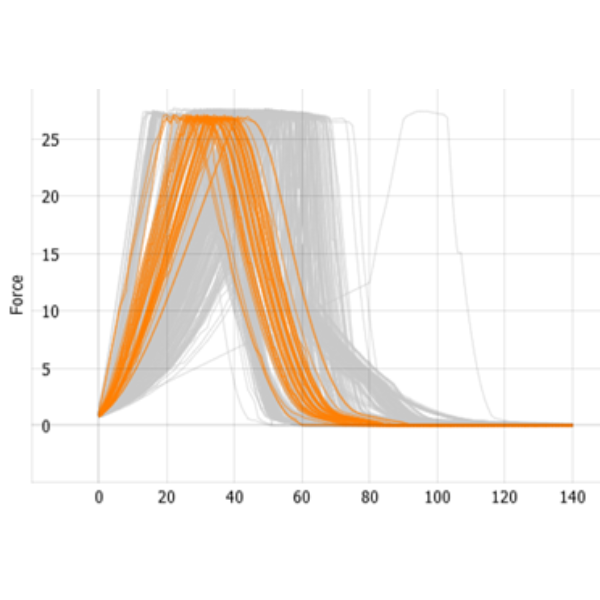
Import many time series as nested table structure to correlate batches with context, e.g. quality or energy use.

Identify critical conditions for many pumps, heat exchangers, or tanks. Or compare usage and performance of machines, hydraulic presses, and vehicles.