Early fault detection for reliable operation of a hydropower turbine

Author: Max Blöchle  – August 31, 2021

Errors can often be seen before they occur. The challenge is to recognize these signs in time while keeping the effort low. This article describes how a water turbine of Verbund Hydro Power GmbH can be monitored based on its expected oil temperature. All required steps – from preparing raw data to creating a prediction model – are described hands-on using Visplore. The innovation lies in the fact that, for the first time, the plant engineer is empowered to process the data without any programming and little data science knowledge. The result is that important domain knowledge is incorporated into the modeling and allows to create a prototype in a few hours!

Fig. 1: Monitor your systems with dynamic tolerance bands around the expected behavior to detect probable faults early
The Problem

Condition-based monitoring (CBM) is an aspect of predictive maintenance. CBM allows to detect faults ahead of time and to optimize maintenance intervals. The challenge lies in dealing with large, complex operating data that may not be fit for direct use, e.g., due to outliers or abrupt changes. The knowledge and experience of the plant engineer is needed to interpret the raw data, to correct it, and to annotate it the following tasks.

The path from the raw data to obtaining a rule for early fault detection involves several steps. First, the data must be checked for plausibility, and suitable parts of the data must be identified for further processing. With this, the plant behavior can be modeled. A model “learns” the normal, desired state of the plant from the historical data, enabling to detect deviations from the expected state during operation. Further findings, such as wear processes between revisions, can be investigated and optimized during the modeling process.

Visplore supports the plant engineer in all these steps. Thanks to predefined views and tools, the plant expert can inspect and prepare the raw data, model it, develop a rule for early warnings, and validate that rule based on actual data.

Understanding and preparation of the complex data basis

The plant under examination is a water turbine, whose operating data was analyzed in cooperation with Verbund Hydro Power GmbH. The data set includes measurements of various temperatures, fill levels and operating states, measured over a period of four years at minute intervals (approx. 2 million values per sensor), and contains a period of revision.

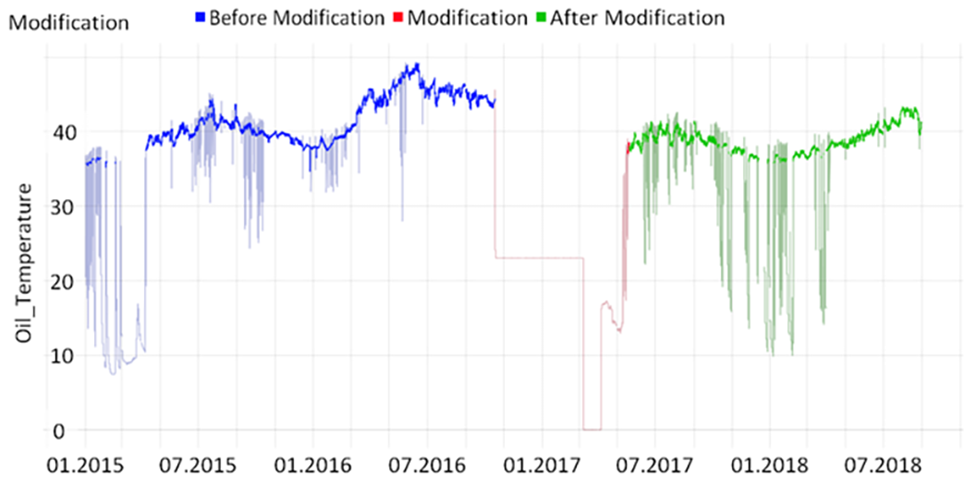
Usually, a large part of the effort is spent on validating and preparing raw operating data before the plant behavior can be modeled. With Visplore, the plant engineer can load data from various data sources and analyze it interactively by zooming and filtering, without any programming or setup effort. For example, it becomes evident at one glance that several sensor time series changed in their characteristics after a plant modification was made at the beginning of 2017 – such as the oil temperature in Figure 2. For the plant expert, it is clear that abrupt changes like these must taken care of when modeling the normal behavior. Visplore allows to easily select these time periods, and to assign corresponding labels (see colored ranges in Figure 2).

Furthermore, the data selection can be limited to periods when the turbine is in operation – shutdown periods are irrelevant for the normal behavior of the turbine. With a few clicks, times where the turbine was operating can be selected directly in the visualization. After doing this, the visualization shows the downtimes of the turbine in a paler color, while the uptimes are shown in strong colors (see Figure 2).
Data selections and labelings as shown in Figure 2 are key information for modeling the normal behavior. In this example, the plant expert considers only the time periods “After Modification” (green) as relevant for modeling the normal state in a way that is relevant for the future.

Fig. 2: Measured oil temperature of a water turbine over 4 years before and after modifications

In some cases, operating data is moreover afflicted by outliers or implausible values. For example, the sudden drops of the water temperature for a single minute as shown below, are not plausible. Such values can be marked directly in the plot, and corrected by a substitute value, such as linear interpolation.

Fig. 3: Cleaning outliers within the visualization

Such issues are not uncommon in operating data. Ideally, a correction would take place in the system in charge of collecting the data, but often this is not entirely possible, or inherently involves domain expertise. By selecting data directly in the plots, switching between overview and detail views, and narrowing down on time periods that matter, a cleaned up operational dataset can be produced in a matter of minutes in Visplore. Both identifying and performing the cleansing steps are much more time-consuming in other tools. The cleaned operational data can now be used for modeling and further analysis. Finally, it is helpful to save these cleansing steps, and to export the cleansed data if required.

Modeling of the plant behavior

For early fault detection, the normal behavior is modeled from the historical data, to define a target state for future operating data. In our example, the expected oil temperature is used as health indicator for the turbine, and modeled based on other measurements such as the water temperature and other sensors. Since the expected value cannot be predicted perfectly with only these variables, a tolerance band can be identified to represent the permissible normal states. If during operation the actual oil temperature comes to lie outside this tolerance band, the underlying data should be investigated by the expert. Together with the tolerance band, the model serves to answer questions like: “Which oil temperature of the turbine would be expected at a water inflow temperature of 20°C?”, or “Is the deviation from the expected oil temperature larger than 1 K, and therefore possibly an indication of an imminent fault?”

A common approach is to model the normal behavior using a relatively long period of time (training data) and to validate the model with different data from another period (validation data). In our example, the operating data after the modification is used as training data (one full season, see the green area in Figure 2). Then, the model is validated with three previously unseen months at the end of the year.

A built-in cockpit in Visplore supports the plant engineer in creating a multivariate regression model. Relevant sensors are automatically ranked according to their influence on predicting the expected oil temperature, and their correlation with the oil temperature is visualized. This allows the plant engineer to quickly identify the relevant variables for modeling.

After a few minutes, an initial model is created based on the upper water inlet temperature and the secondary oil level to predict the expected oil temperature of the water turbine (see Figure 4). Transformations of the influence variables, such as the squared power of the upper water inlet temperature, are automatically taken into account, which can be seen from the nonlinear regression line. Figure 4 also shows that the measured values scatter only slightly around the regression line. The permissible tolerance band for the normal condition can thus already be estimated from Figure 4: the points scatter approximately 1 K around the regression polynomial, here depicted as a function of the upper water inlet temperature:

Fig. 4: Expected oil temperature of a water turbine as a function of upper water inlet temperature

To further validate the model, the deviations, also called residuals, are examined more deeply in Visplore. For example, the error appears to be larger at lower turbine flow. This is an indication that the turbine flow and other variables should perhaps be included in the model.

Once the relationship of the oil temperature to the upper water inlet temperature and secondary oil level is modeled satisfactorily, the model formula can be exported. Here, it is a multivariate linear regression with terms up to the 4th power, which is available as Python code and can be written in a simplified way as follows:

Predicted oil temperature = (oil level * -147.6836) + (water temperature ^ 2 * 0.0160) + (water temperature ^ 4 * 0.00004) + ((oil level ^ 2 * 0.5391) + ((oil level ^ 3 * -0.0007) + 13513.9405

Using the model to prototype an early detection rule

The model can now be used as the basis for early fault detection. For this purpose, the plant engineer needs to select a threshold value for triggering a warning, which has already been roughly estimated graphically as ±1°K around the oil temperature predicted by the model. Visplore assists the plant engineer in selecting the threshold by highlighting any violating time points, and showing their number of occurrences in the validation data. Thus, a tolerance band between ±0.6 K is identified as appropriate in the validation data. This threshold registers 98.5% of the days as normal operation. However, one day stands out from the rest due to significant threshold violations (see Figure 5 and Figure 6). On this day, a deviation of the measured oil temperature from the expected value of 0.7 K was observed repeatedly . These out-of-range values are followed by a shutdown of the water turbine at 22:40. At the same time, it is noticeable that the primary oil level rises considerably during this day (see Figure 6).

The model and its threshold can finally be implemented for operation in the SCADA system (not within Visplore). As soon as the oil temperature exceeds the dynamic threshold, a warning is sent to the plant operator. The operator can then evaluate the overall situation of the plant with the current operating conditions in Visplore and reach a decision. Any points with deviations, in particular, are immediately highlighted. Depending on the type of fault, measures can be taken in advance instead of having to react when the fault has already occurred.

Fig. 5: Deviation between measured and expected oil temperature. After noon, the deviation exceeds the tolerance bounds significantly.

Fig. 6: Rising oil level with increasing model deviation followed by a shutdown

The operating data and model can subsequently also be used as a basis to plan and optimize for the next revision. For example, it was found out that the oil temperature increases in relation to the water temperature over the years, and is at its lowest after the turbine modifications. This relationship is a potential indicator of the wear of certain plant components.

Summary

This article describes how Visplore supports various stages of developing of an early fault detection rule for a water turbine: from the preparation of the raw data by visualizing, validating, cleaning and labeling the data with expert knowledge, followed by model generation using multivariate regression. All introduced methods only make use of already existing operating data.

A key innovation of this story is that the plant expert can identify a model in a few hours based on their expert knowledge, but without the need of programming skills. In the case at hand, the model provides an indication of an impending problem as early as 7 hours before the turbine is shut down. In addition, the processed operating data provide the basis for further findings and optimizations such as better maintenance intervals or a higher energy output. It is to be noted that, in this particular case the detected anomaly turned out not to be a fault but an extraordinary operating case, after investigation. Still, it demonstrates that a potential fault can be indicated by the found rule.

In the present case, the method presented was further developed and the multivariate regression was replaced by a Bayesian network. As part of the “digital power plant” initiative, Verbund is currently testing the suitability for parts of its power plant portfolio. In this process, power plants are upgraded and the methods are evaluated for events in the past.

If you would like to learn more, we are happy give you a live demo and to discuss your potential applications in a call. Visplore gives you a look at your data that we promise you haven’t experienced before!

About Max Blöchle

Max Blöchle has been working in the field of energy and R&D for the last 20 years. With his background in IT he has specialized in data science to optimize the reliability and efficiency of systems. With his experience he trains and supports domain experts on innovation topics such as no code data analytics and digitalization.