Standard Features
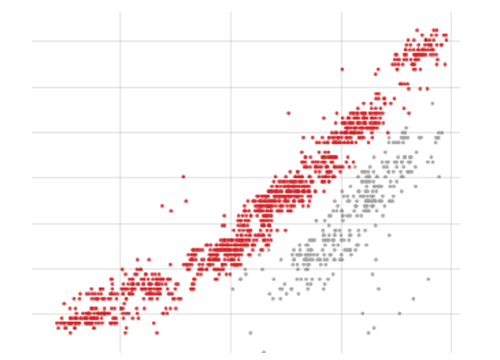
Correlation analysis
Discover correlations, compute correlation measures, and rank variables by their correlations with a target.
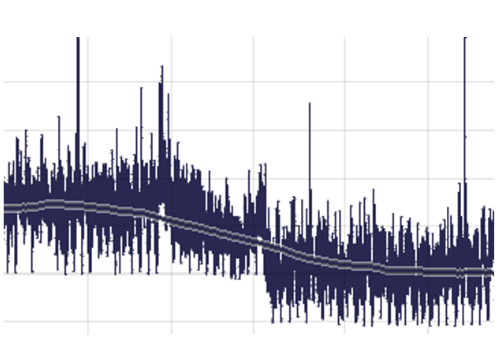
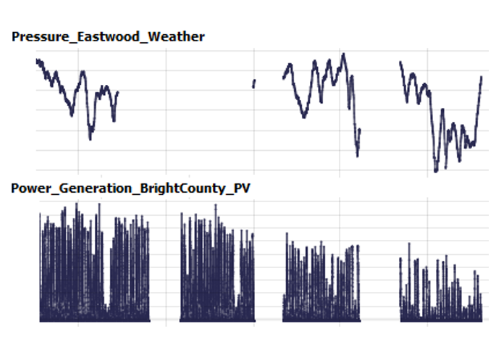
Time series trending
Spot any pattern from slow trends to sudden jumps for hundreds of time series, and overlay moving averages in your graphs.
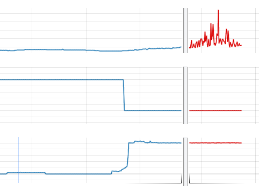
Root-Cause analysis
Compare anomalous time periods to normal operation, and identify process parameters that have changed – to explain anomalies, or increased scrap production.
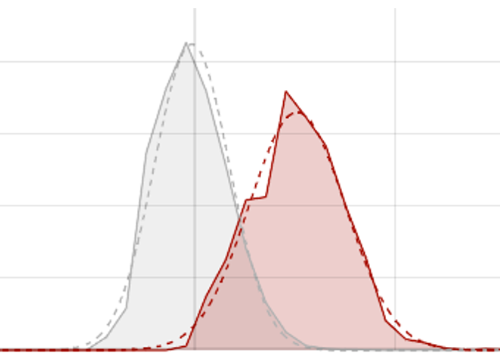
Comparative analysis
Compare time periods in detail by their graphs, statistics, distributions, statistical tests, and much more.
Missing value overview
Assess the completeness of your data at a glance and analyze the distribution of gaps in detail.
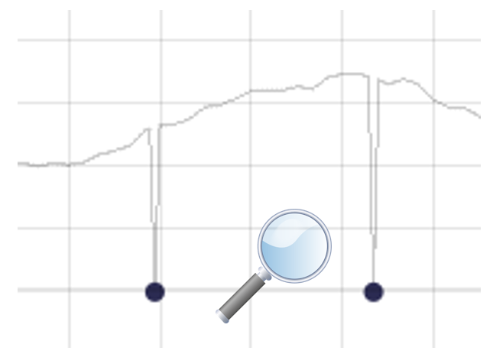
Outlier detection
Discover anomalous data for further analysis or cleanse your data by removing outliers and spikes with a single click.
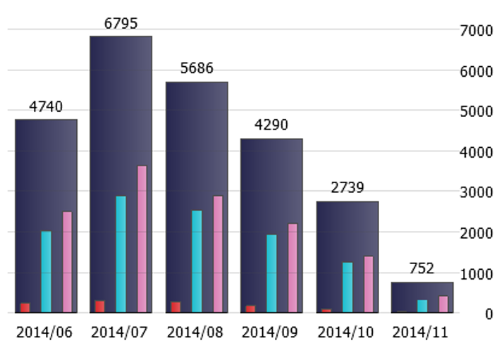
Pivot table summarization
Summarize your data by products, days, or any other data categories and visualize your summaries using various chart types.
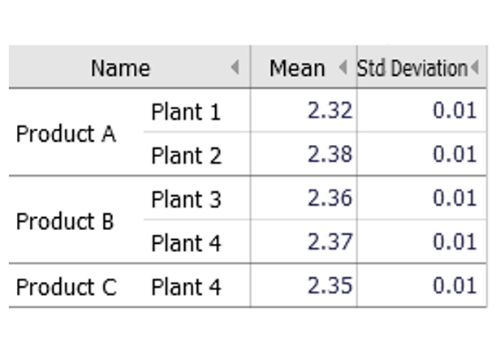
Descriptive statistics
Characterize your data by numerous statistical measures and compare the statistics for any parts of the data.
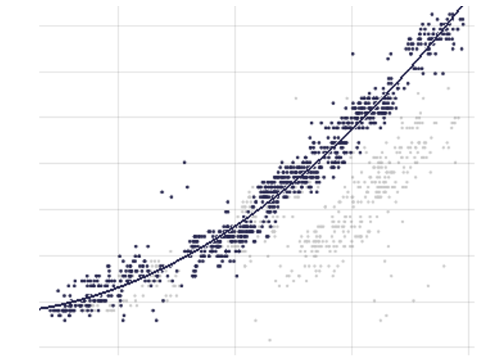
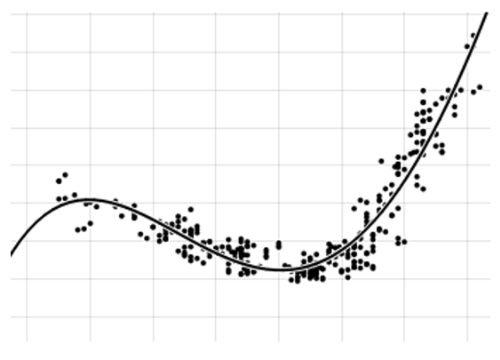
Regression line fitting
Express relations between variables by regression functions which update instantly upon interactive data selection.
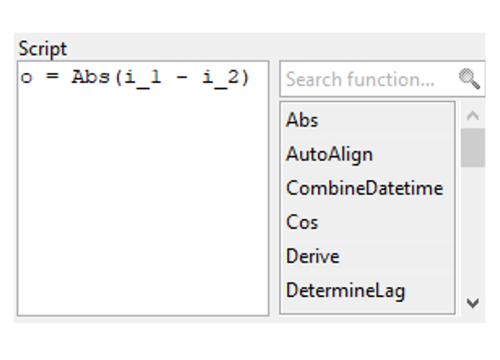
Python-based formula editor
Compute new data with maximal flexibility by using powerful functions and embedded Python code.
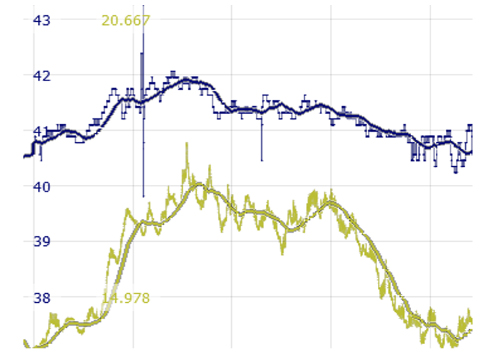
Smoothing and time-shifting
Derive new time series via smoothing, time-shifting, and many more functions and tune their parameters at any time.
Pro Features
Pattern searchPro
Search recurring patterns in time series automatically and compare up to thousands of them for trends and anomalies.
Regression analysisPro
Build multivariate regression models automatically or step-by-step and study dependencies in your data in detail.
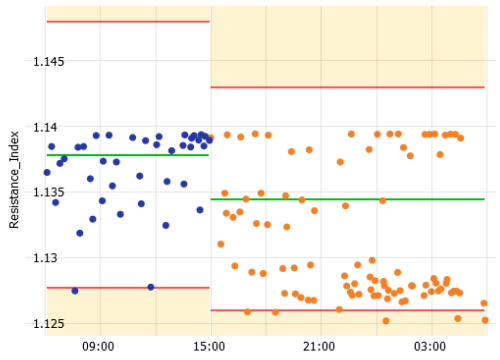
Statistical process controlPro
Specify setpoints and tolerance limits for visualization and break down process KPIs along time, products, grades, and much more.
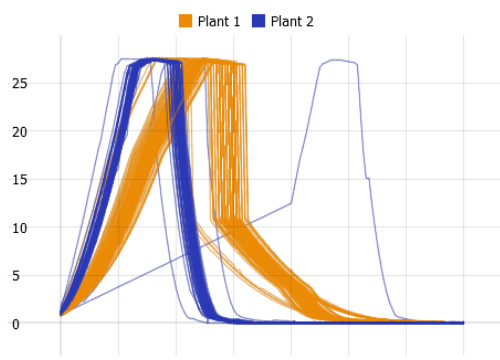
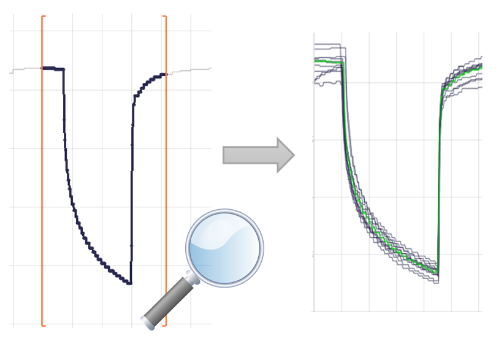
Analytics of many curves and spectraPro
Analyze thousands of curves from machine operations or measured spectra and correlate them with contextual information such as process and quality parameters.
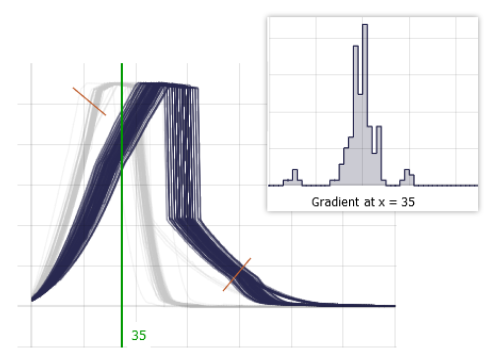
Curve KPI extractionPro
Extract meaningful curve features by intuitive specification in the graphics and include these KPIs in your analysis.
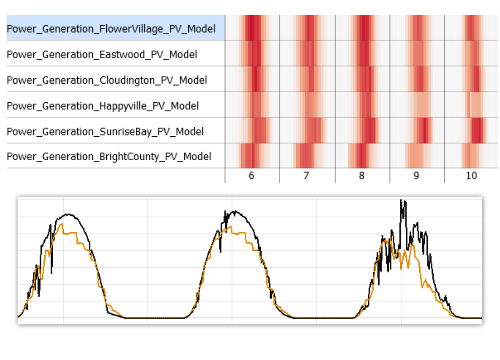
Predictive model validationPro
Monitor the performance of many predictive models, compare them in detail, and discover new ways for optimization.
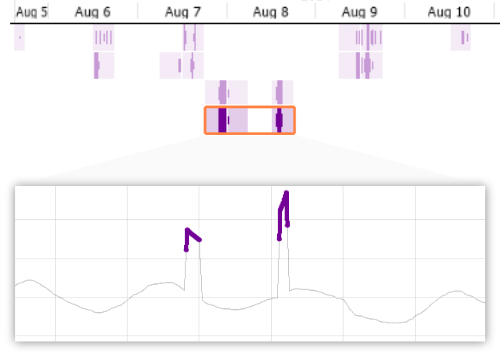
Time-series anomaly detectionPro
Employ advanced analytics to detect anomalies in time series and see their distribution at a glance.