Visplore version 1.6.
The new version 1.6 extends many popular features, enabling even better workflows for transparent time-series analytics.
To see many of the enhancements in action, watch our webinar recording from May 21st, 2024:
Joining multiple data sources via keys
While version 1.5 introduced to join multiple data sources via time information, version 1.6 extends data integration capabilities by joining data sources via key attributes. For example, assume the process data from a historian contains the ID of a material used. Then version 1.6 lets you join additional information about the material from a data base or ERP system via the IDs, for example the supplier and the unit price. As another use case, if your data contains multiple physical assets (such as pumps, turbines, vehicles, …) you can now easily join asset information via the asset ID, such as the location, the manufacturer, the commissioning date, and so on. The join may involve multiple keys. For example, in a batch production, you may join quality- and yield-related KPIs to process data from multiple reactors via both the batch ID and the reactor ID.
Improvements for extracting and comparing patterns
One of Visplore’s most favorite features is the possibility to extract, compare, and analyze recurring patterns such as ramp-ups, machine operations, and phases of a batch production. Version 1.6 extends the analysis of patterns in several ways:
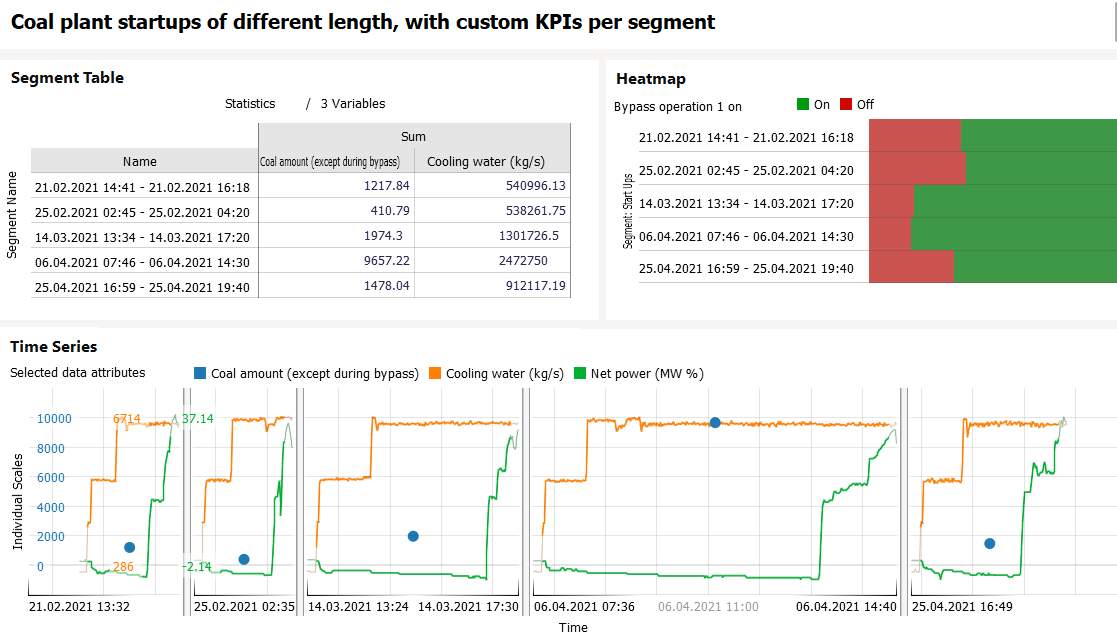
- Multi-interval pattern search: You can search for patterns based on multiple sub-patterns and thus extract patterns with different durations. For example, assume you have process operations with a varying duration. You can now extract them based on selecting a start pattern (eg ramp-up) and an end pattern (eg. shut down) of a reference operation. This will find and correctly extract the entire operations despite their different durations.
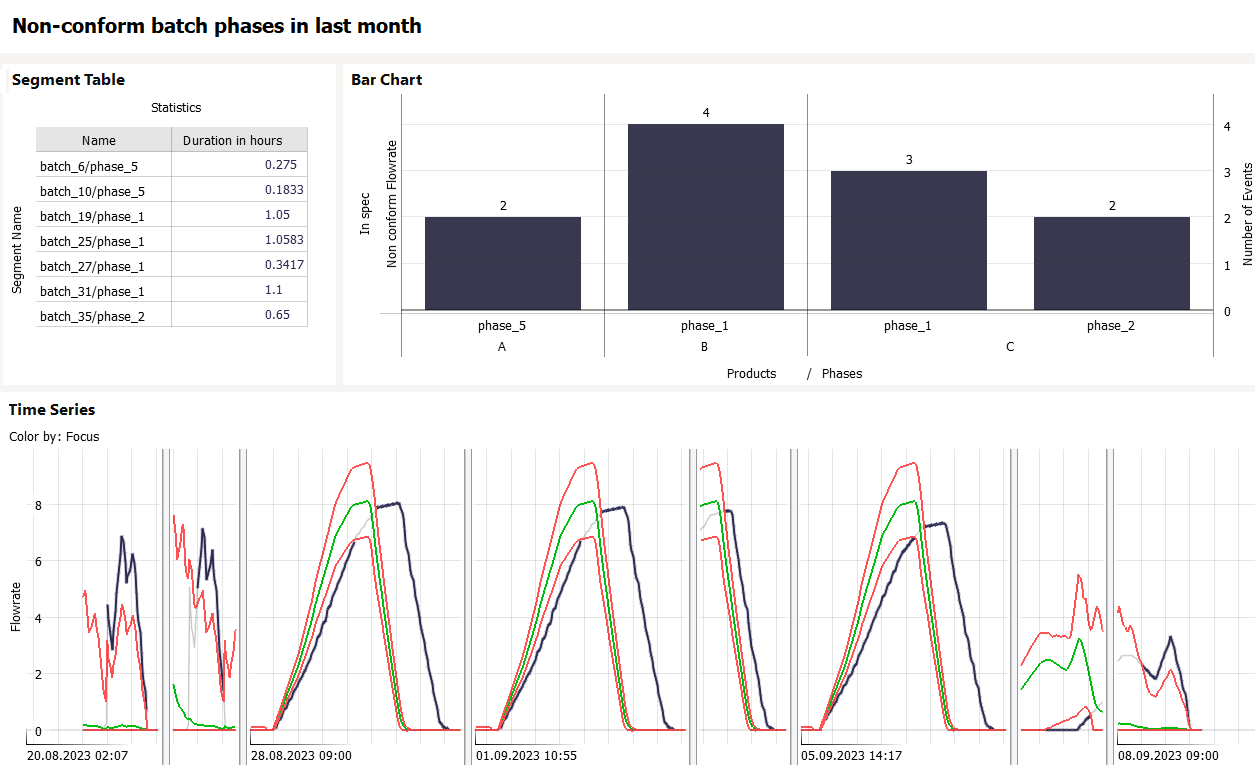
- Loading reference pattern from file: Many analyses involve the comparison to a reference pattern such as an ideal (“golden”) profile. Version 1.6 lets you load reference patterns from files for a pattern search and the analysis of the extracted patterns. For example, this can be used to identify ramp-ups, shut-down, and batch production steps that deviate too much from a given reference profile.
- New segmentation methods for precise pattern definition: Version 1.6 introduces new possibilities to precisely define complex patterns. For example, the definition can be based on formulae for start and end conditions, e.g., start when temperature exceeds 50 degree, end when pressure sinks below 5 bar. Also value changes can now easily be used to define patterns. For example, extract all events 2h before until 3h after the tag “operation” switches from 0 to 1.
- Easier definition of KPIs per pattern: Once patterns such as ramp-ups and batch production steps are extracted, the analysis typically involves KPIs extracted from these patterns. In version 1.6, it has become easier to specify custom KPIs based on formulae. This includes, for example, custom durations such as the time it takes for pressure to drop from its peak until below 5 bar.
Image context in Scatter plots
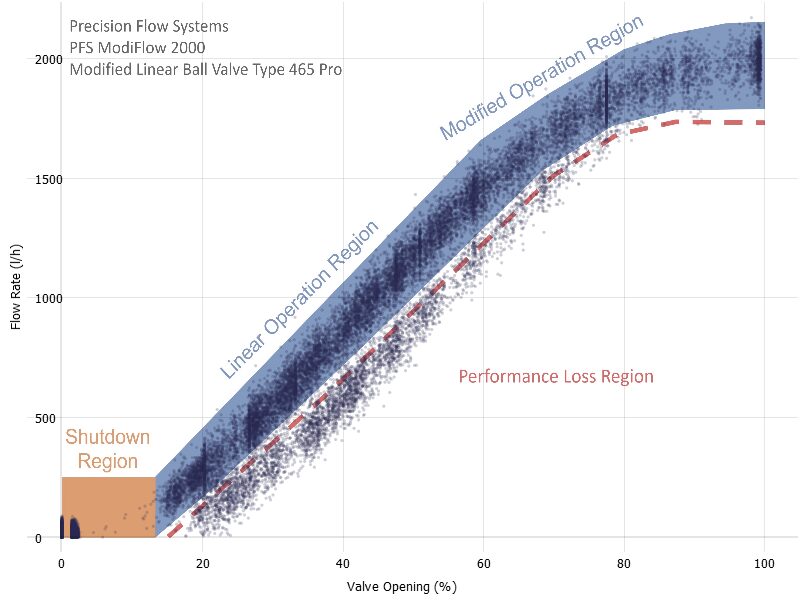
2D Scatter plots (XY Plots) are versatile charts, but some analyses require context in addition to the mere data points. Version 1.6 lets you specify graphics files such as PNGs and JPGs to provide that context, and the align them precisely with the scaling of the data. This can, for example, be used as follows:
- Display operation curves and regions: For a pump, for example, this lets you relate measured data about flow and head to the supplier specifications.
- Display maps of assets: For example, a map can be very helpful for quickly localizing assets which have problems. This can be small-scale (e.g., machines within one production site) or mid-scale (e.g., probes distributed within a city).
Improvements for analysis templates (“Story”)
A common use case of Visplore’s story pages is to configure them as templates for recurring analysis tasks. In version 1.6, the pages may optionally share the data rather than keeping all pages isolated (which is still possible, if needed). For example, computed variables added in one page now become available in other shared pages too. It is also possible to cleanse outliers in one page and benefit from the cleansed data in the other pages. This can streamline recurring analysis workflows significantly. As another improvement, users may now adjust the loaded time period upon opening a visplore file.
Data attributes can be renamed
Often requested by users, data attributes can finally be renamed. This applies to data attributes which are imported from a data source as well as to computed data attributes.
Easier handling of computed data
Managing computed data has become much easier. Version 1.6 shows all computed data objects (such as variables, conditions, etc.) at a glance and allows for editing, cloning, and deleting them.
Improvements to conditions
Since version 1.6, conditions may optionally include the filter in their definition. This enhances the what-you-see-is-what-you-get effect and facilitates same data labeling workflows, e.g., to define a label differently per class.
As another improvement, conditions support to optionally include short interruptions. For example, if a condition “normal state” refers to all periods in which a variable is within the range of 10 and 20, short interruptions (e.g., up to 10 minutes) may now optionally be included and also considered as “normal state”. This makes it easier to robustly define events in noisy data.
Improved user interface
A lot of UI elements have been enhanced. For example, tooltips look nicer and are easier to read. Moreover, most dialogs can now be closed via “x” rather than by moving the mouse cursor away from the window. Last but not least, using Visplore finally also works seamlessly when sharing the screen in online meetings using WebEx, Zoom, etc.
Connectivity to AVEVA Historian
Visplore now supports for directly connecting to an AVEVA Historian (formerly known as “Wonderware”).
In a nutshell: lots of added value for you to get the most out of your data!
The best way to experience all this is to watch our webinar from May 21st or contact us for a live demo!
Either way, we are looking forward to talking to you soon!


