Data-driven troubleshooting made easy & fast

Speed up root-cause analysis of technical assets and processes by 100x and more

Try Visplore with your own asset data — for free!
Demo – Troubleshooting a turbine at Hafslund
(4 min)

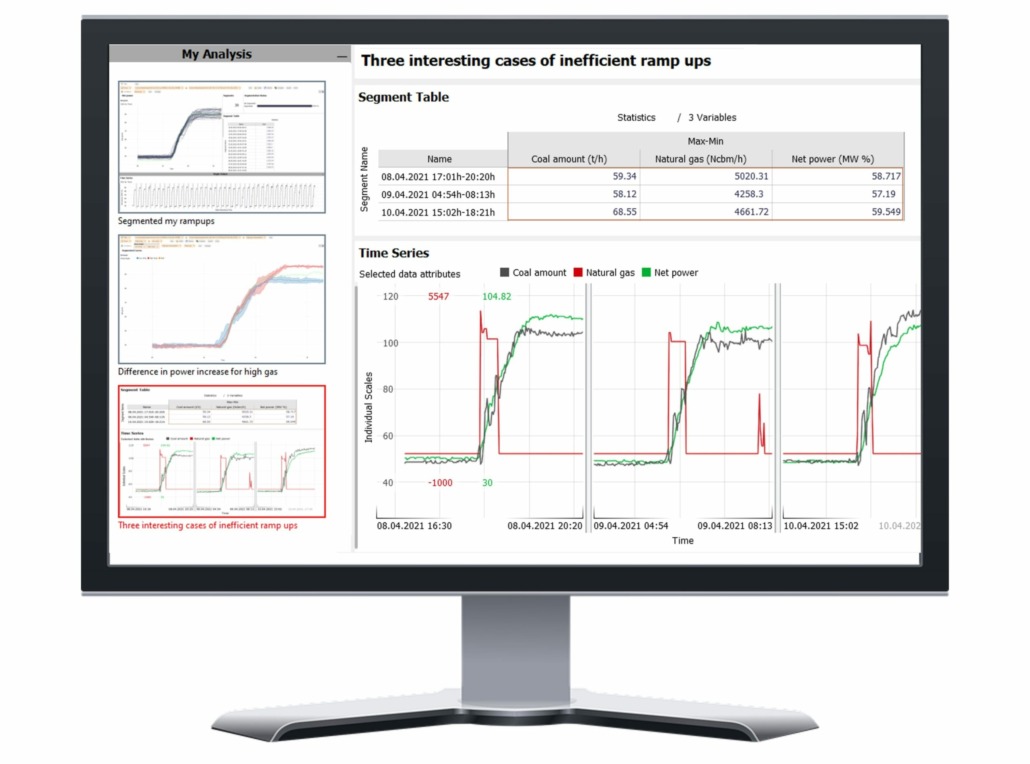
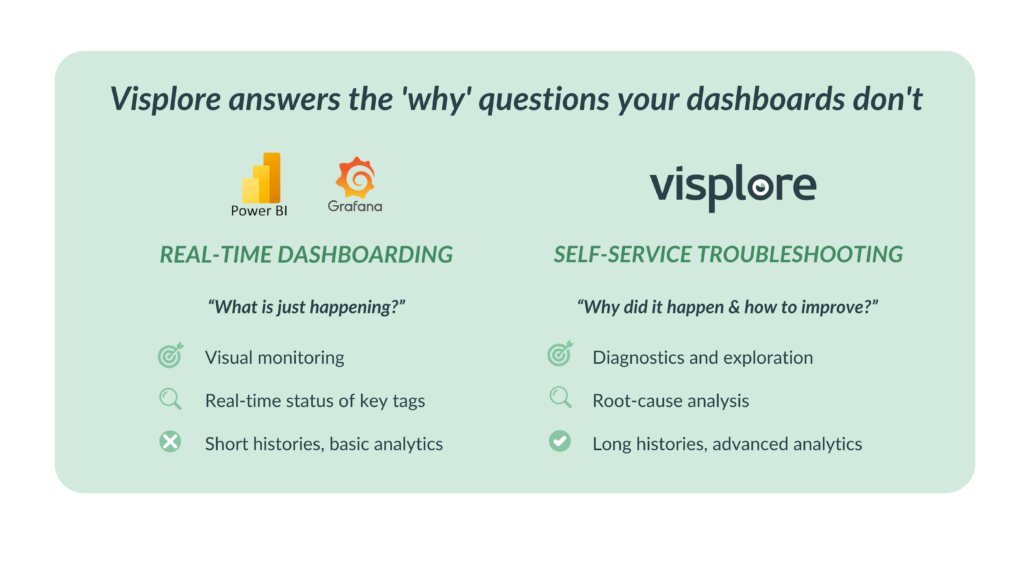
Easy-to-use analytics for operations & maintenance

  • Fast troubleshooting

    with pre-configured analytics tools

  • Advanced condition monitoring

    for quick insights to make informed decisions

  • No coding required

    for subject-matter experts, minimal training

  • Interactive sharing & reporting

    with flexible licenses allowing automated report creation

Why choose Visplore?

LESS DOWNTIME

with faster troubleshooting & monitoring

LESS WORK HOURS

spent on data preparation in spreadsheets

OPTIMIZED PROCESSES

by continuous data-driven improvements
Customers worldwide are using Visplore

 
Verbund
Tenaga Nasional
mondi
illwerkevkw
GF
KTM Sportmotorcycles
AIT - Austrian Institute of Technology

Use Cases for real value

Troubleshooting in heat bearing

Hydropower producer Hafslund Eco shortened the maintenance downtime of a Francis turbine by early detection of an overheating bearing with Visplore – avoiding 1,1M Euro revenue loss.

How Hafslund Eco cut Francis turbine maintenance downtime by 50%, avoiding €1.1 M revenue loss.

“Pattern anomaly detection and fast correlation with contextual data empowers the engineers to make data-driven decisions that save millions of EUR.”

— Thor Arne Hvam Bruun, Turbine specialist, Hafslund Eco

Optimizing gas turbine operations

Belgium’s second largest energy supplier and producer used Visplore for reducing downtimes, ensuring compliance and faster troubleshooting in gasfired power generation and district heating.

“Visplore has become a key tool for our engineers operating and maintaining power generating assets, and enables data-driven decisions much faster.”

– Siebe van Hullebusch, Asset Performance Engineer
Integration and preparation

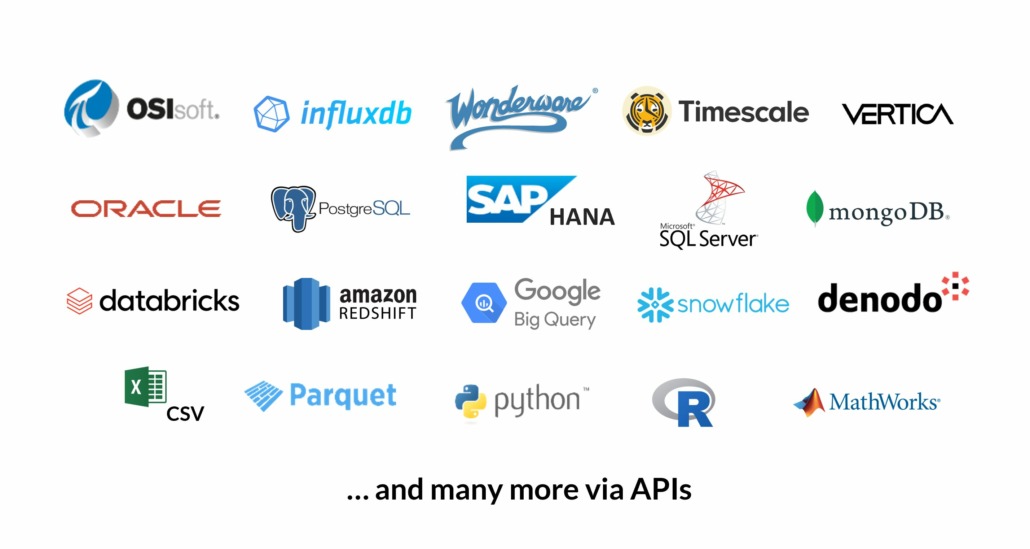
Break up data silos by merging data from PI, SQL databases and various files types. Align time rasters, and include assets, quality samples, batch event frames or ERP data in your correlation. All interactively and without coding! Any analysis can update as new data arrives – for condition monitoring or live reports. With our Python APIs, you can add own data sources, such as legacy databases or custom files. And fully automate workflows for alerting, reporting or result writeback.

Break up data silos by merging data from PI, SQL databases and various files types. Align time rasters, and include assets, quality samples, batch event frames or ERP data in your correlation. All interactively and without coding!

Any analysis can update as new data arrives – for condition monitoring or live reports. With our Python APIs, you can add own data sources, such as legacy databases or custom files. And fully automate workflows for alerting, reporting or result writeback.