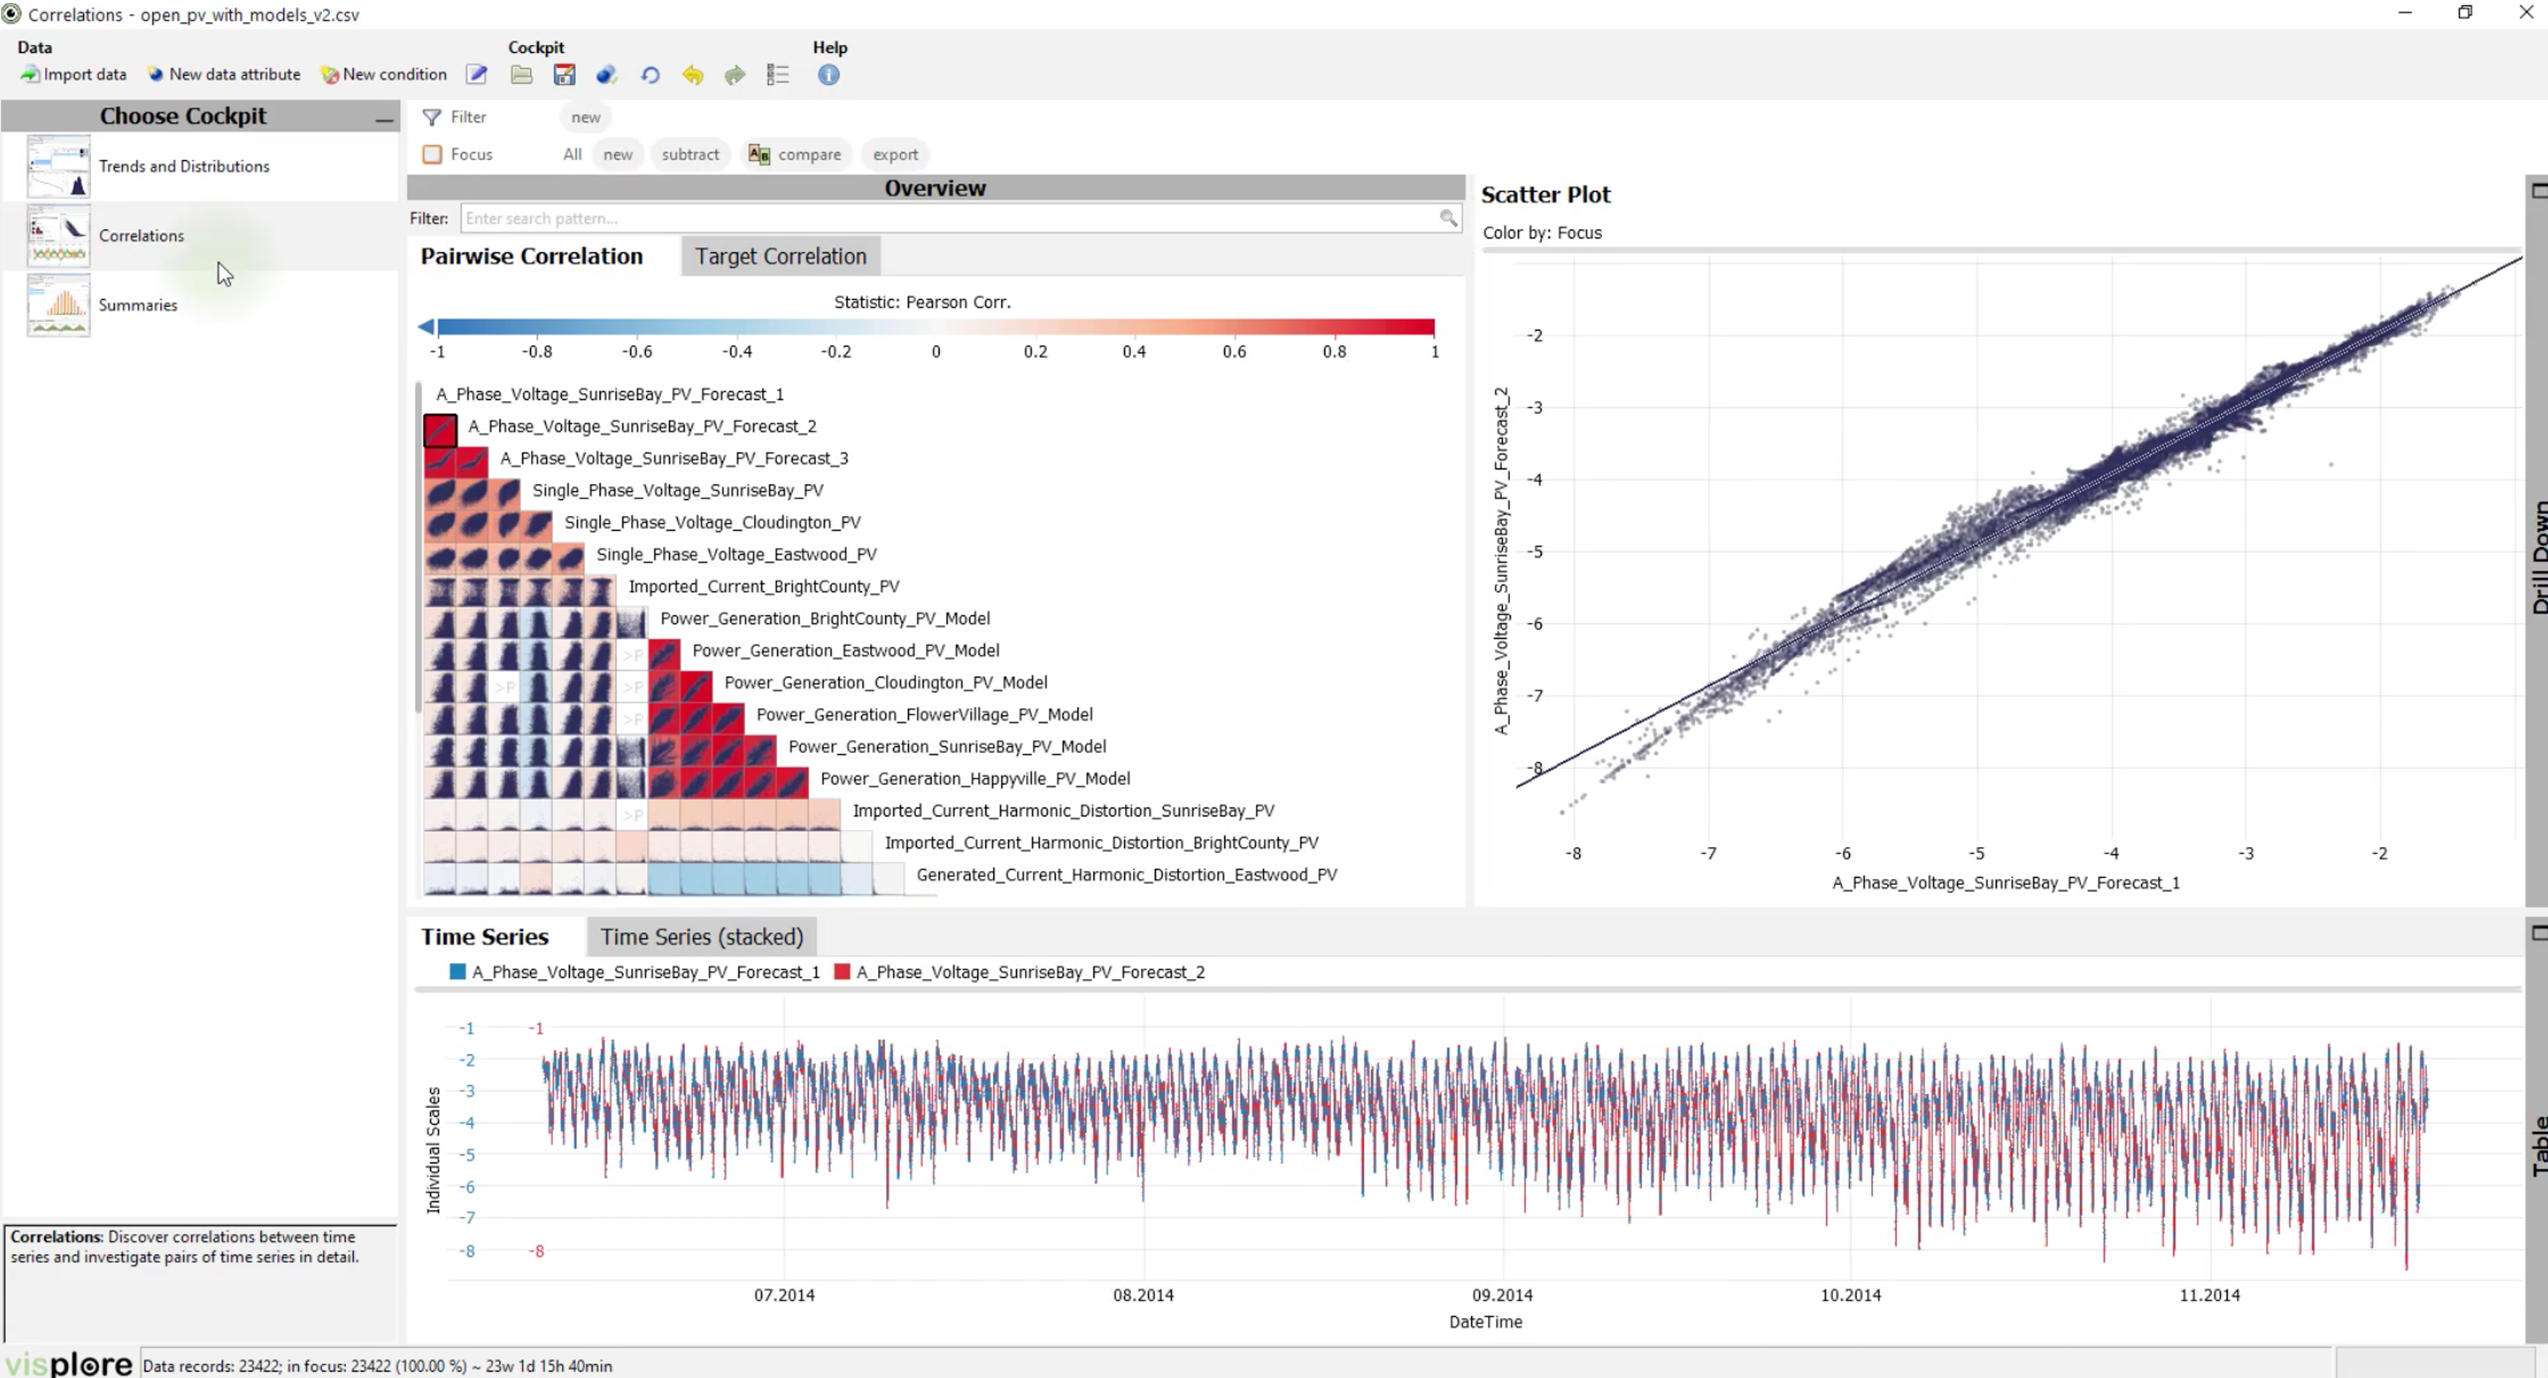
Time Series Correlation Analysis with Visplore

Save valuable time in your correlation analysis.

Correlation analysis is a key feature of every Visplore version, including Visplore Free.
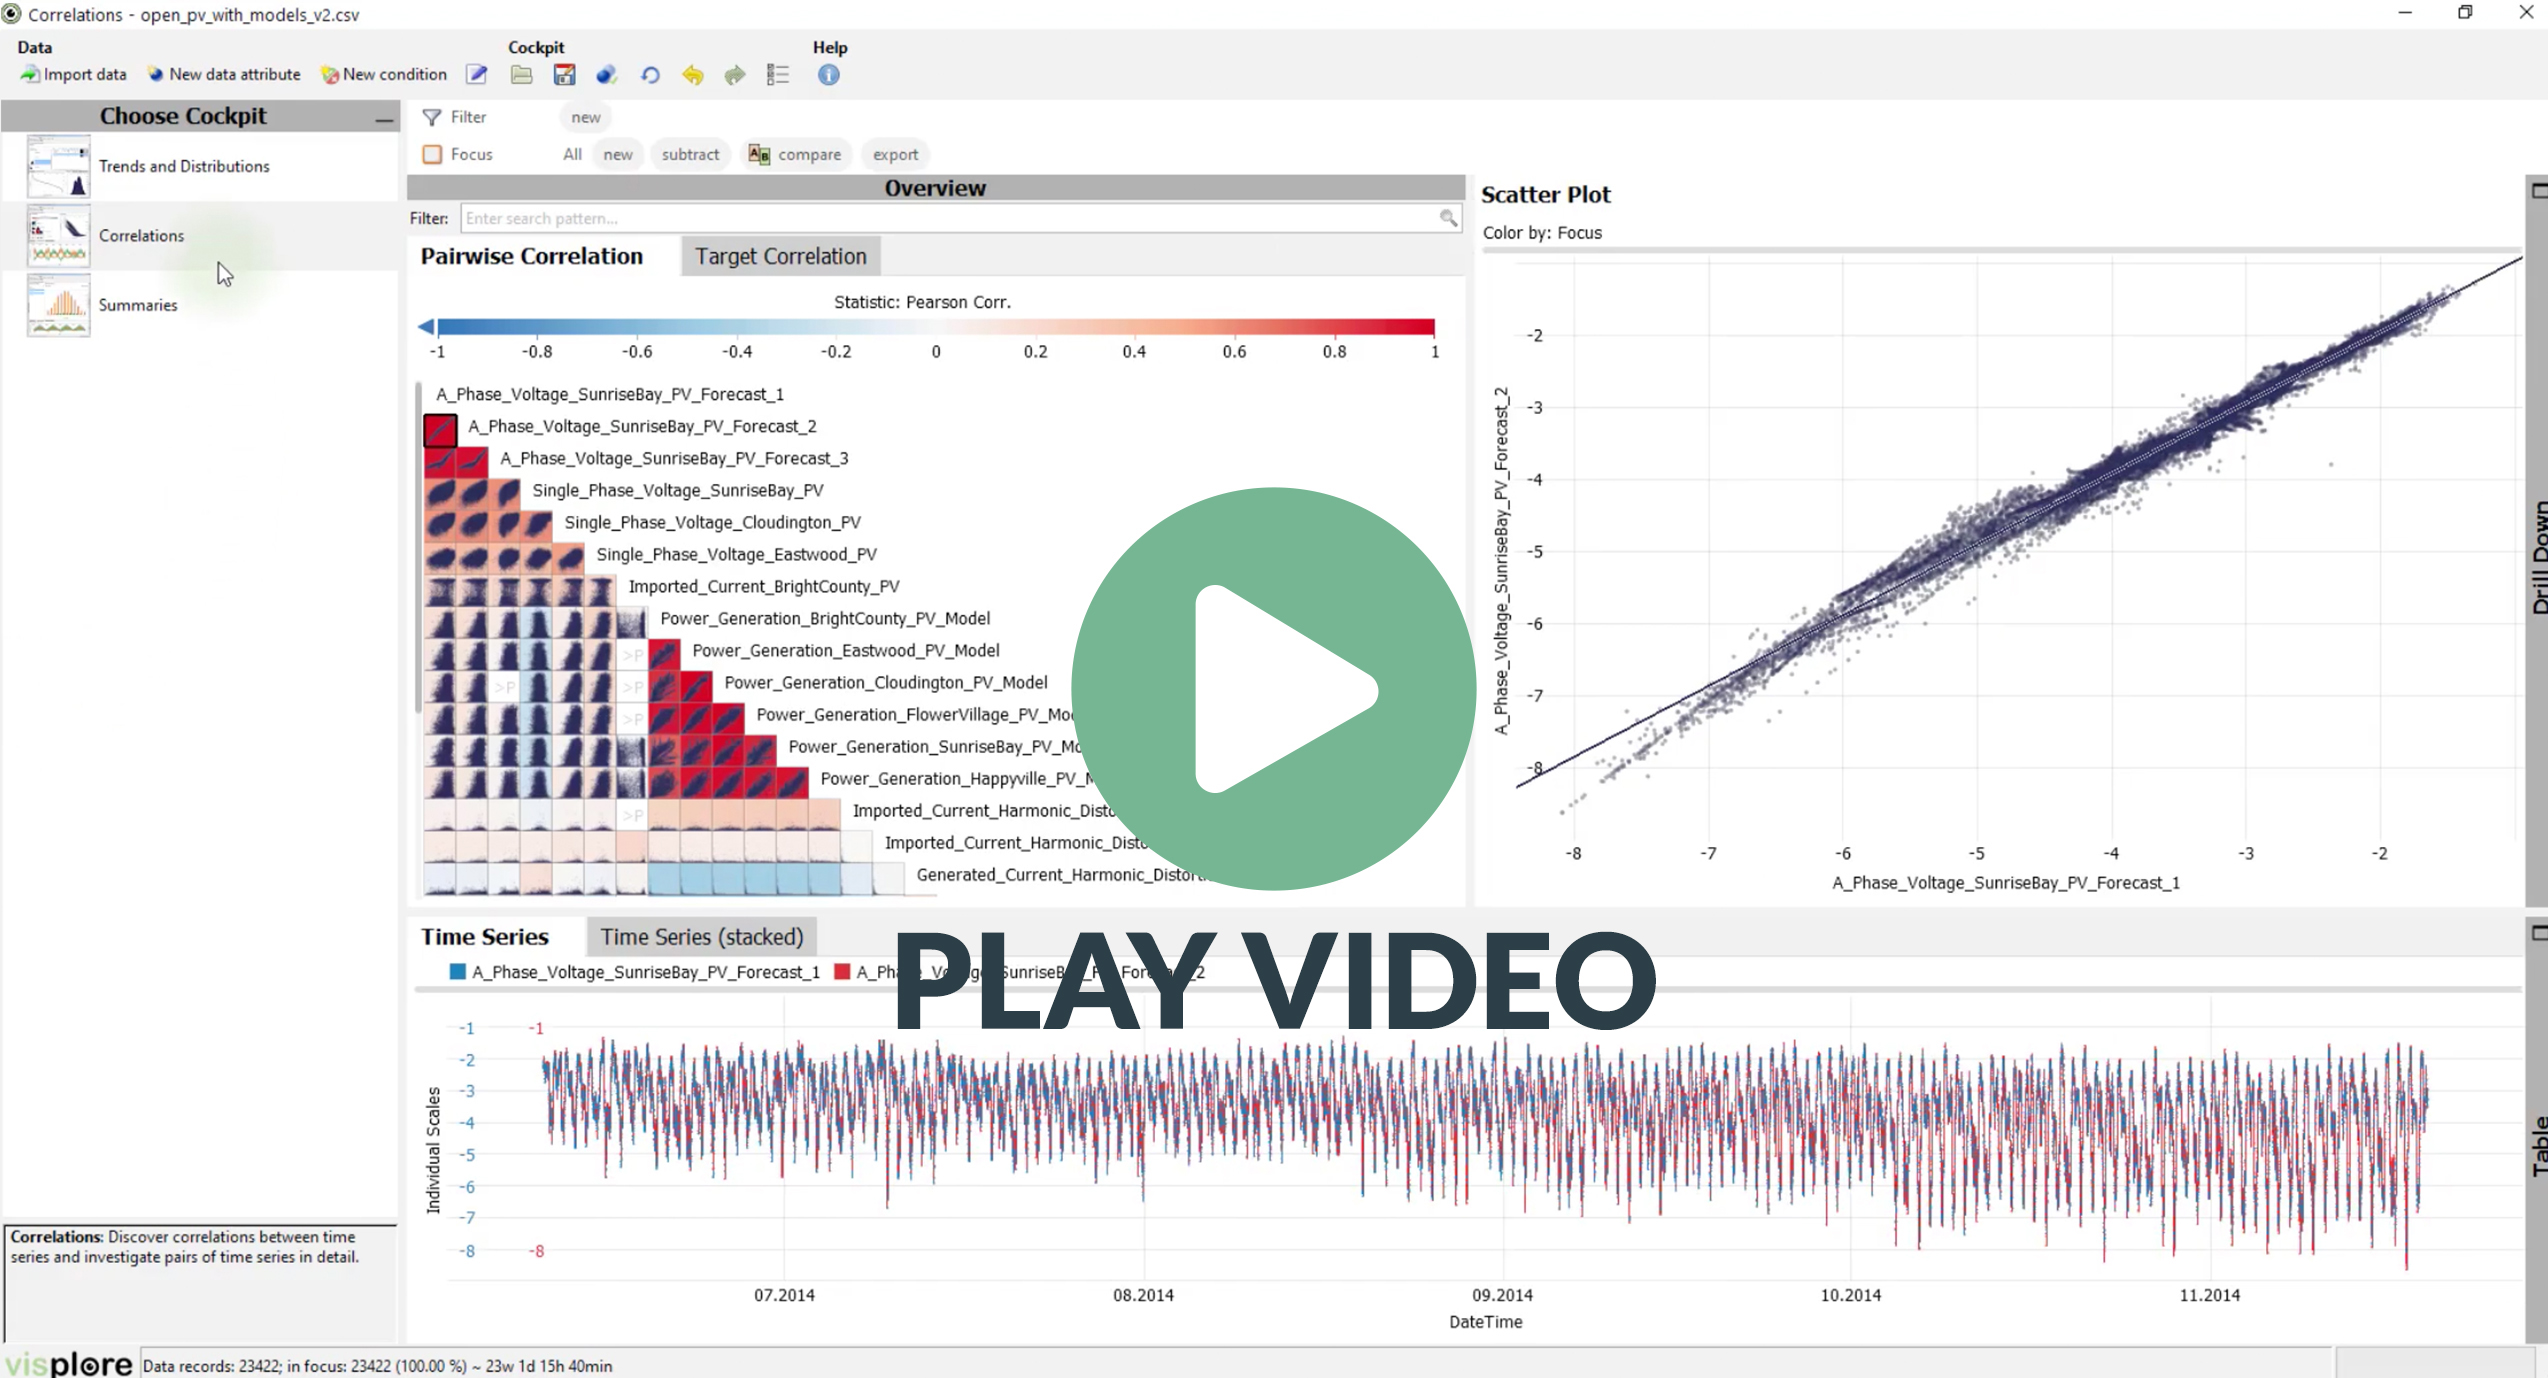
Visplore Correlation Analysis in Action

Deep correlation analysis
without preparation and effort

All Visplore versions feature powerful interactive tools for correlation analysis. These tools will help you to discover and model correlations while minimizing the effort for data preparation and result validation.
  • Discover correlations among dozens of variables in seconds
  • Understand correlations with a specific target variable
  • Access correlation coefficients and p-Values any time
  • Validate correlations in scatterplots & time line views with 1 click
  • Refine your results by selecting coherent, plausible data – all correlations update immediately
  • Break down complex correlations by unlimited drill-down possibilities
  • Fit and export regression functions

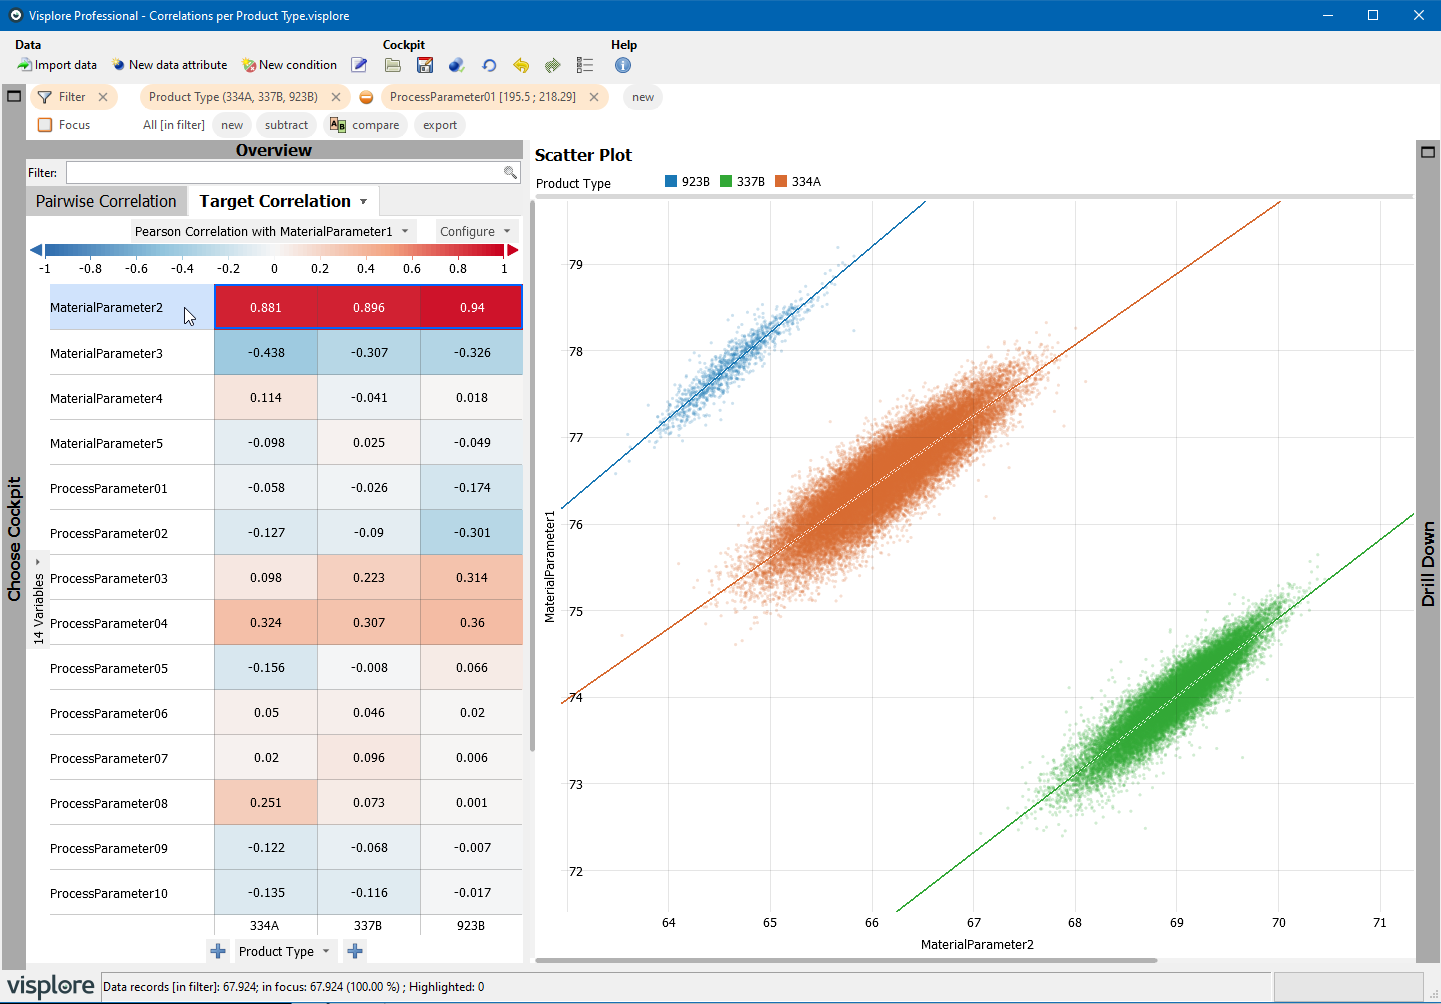
Different product types form clusters that can easily be distinguished for correlation analysis.
Click Image to enlarge
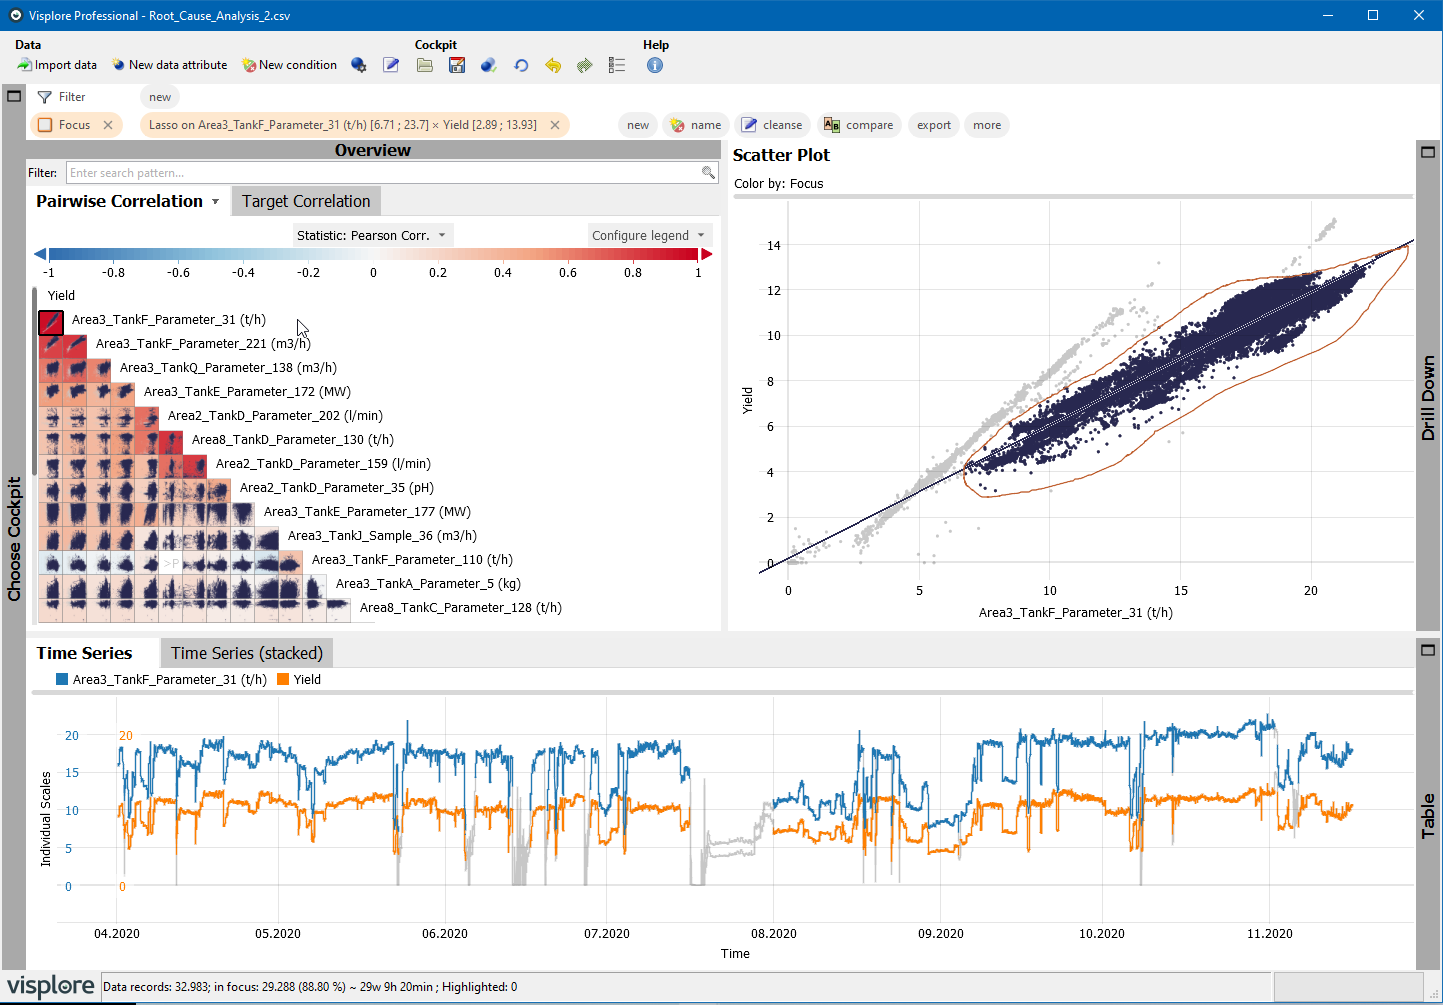
Discovered clusters can easily be selected to focus the analysis on the relevant cluster.
Click Image to enlarge

Correlation Analysis with Visplore

When working with real data, correlation analysis can be full of challenges.

Outliers may introduce bias. Misleading results may be produced if the data consists of multiple clusters and these are disregarded. For example, changes to an industrial process may affect how sensors correlate with each other and require that correlations are computed separately before and after the change. In general, data preparation and result validation are important when analyzing correlations and may account for the majority of the overall effort.

Visplore reduces those challenges to a minimum – and saves you valuable time.

Working with correlations

Correlations between variables play a key role in data science, engineering, and many other fields. The purpose of correlation analysis is manifold and ranges from data exploration and feature selection to understanding sensitivities and doing root-cause analysis of industrial process data.

Why our customers
prefer Visplore

Perfect for dirty sensor data. With Visplore, we give customers more insights for the same money.

When we need it fast, we use Visplore.

Visplore enabled us to gain significant new insights from massive data about the impact of production process parameters on product quality.

Thanks to its ease of use and high performance even with millions of measurements, Visplore has established itself as our standard tool for quality management in plants from China to South America.

Checking and cleaning data from energy systems used to be very time-consuming and kept us from our core tasks. With Visplore, data preparation has become much faster, and the quality of the resulting data has improved.

The good usability and the comprehensive visualizations enabled us to gain a deeper understanding of routinely collected data and their relationships. For example, this increased the quality of forecast models.

Visplore is recognised and in use as a central strategic software for data analytics throughout the company.

By analyzing process data from a large foundry with Visplore, complex dependencies were detected that we didn’t find with other software. As a result, our customer’s heat energy was reduced by around 5% and mold wear by around 4%.

For our thermodynamical simulations, Visplore helps us to identify suitable data, eliminate outliers, and analyze physical processes very effectively.

The visualization is fast and simple enough for live collaboration with the customers, on site. By this, Visplore supports a thorough understanding of correlations, outliers, and anomalies.

Visplore makes our analysis of sustainable energy systems much more efficient.
In addition to the performance for large data, its integration with scripting environments is a big plus.

Visplore allows for a much easier investigation of relevant patterns and structures. Our downstream analysis becomes more efficient and we gain more confidence in the results.

 
mondi
GF
Verbund
APG
AIT - Austrian Institute of Technology

Understand correlations like never before.

Free forever for academic/personal use