Troubleshooting Energy Distribution Assets

Longer and more reliable asset utilization is critical in the energy distribution sector.

Read here how a transmission provider used Visplore to improve the reliability of a power transformer and increased its life expectancy by an estimated 5 to 8 years.

Troubleshooting energy distribution assets
Find root-causes of malfunction with minimal effort

Visplore Professional features a ready-to-use solution for troubleshooting energy distribution assets and allows to find root-causes of asset malfunction from complex operation data within a very short period of time.

  • Explore asset operations at a glance
  • Screen your data for completeness & plausibility
  • Select and cleanse data intuitively
  • View trends and correlations rapidly
  • Calculate asset health indices easily
  • Get most relevant indicators automatically
  • Compare periods of malfunction to regular operation
  • Enjoy high performance with large data

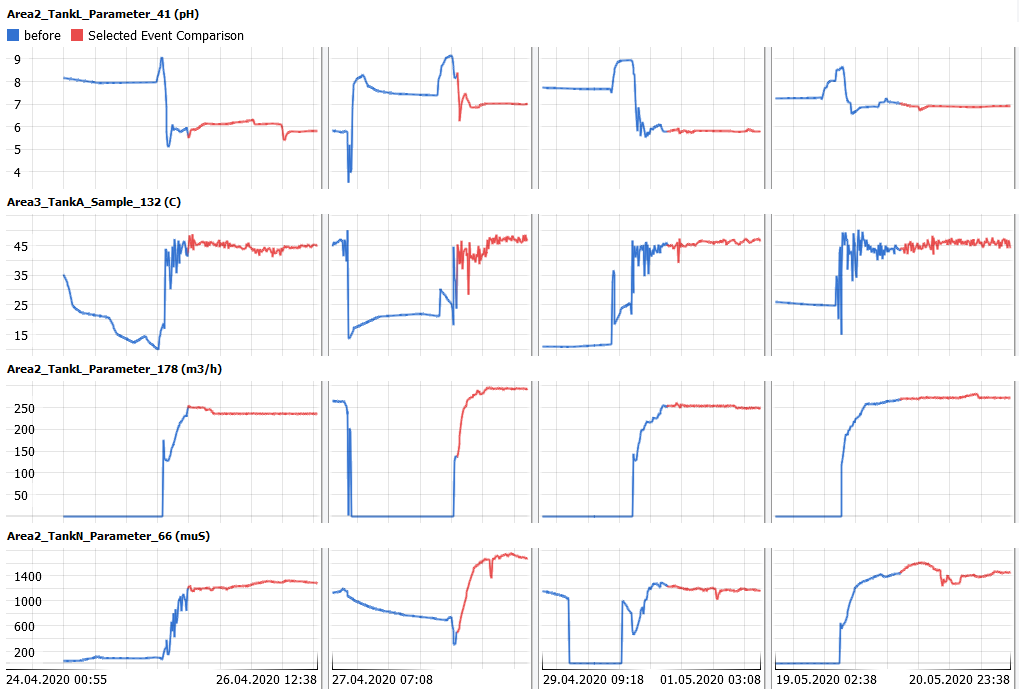
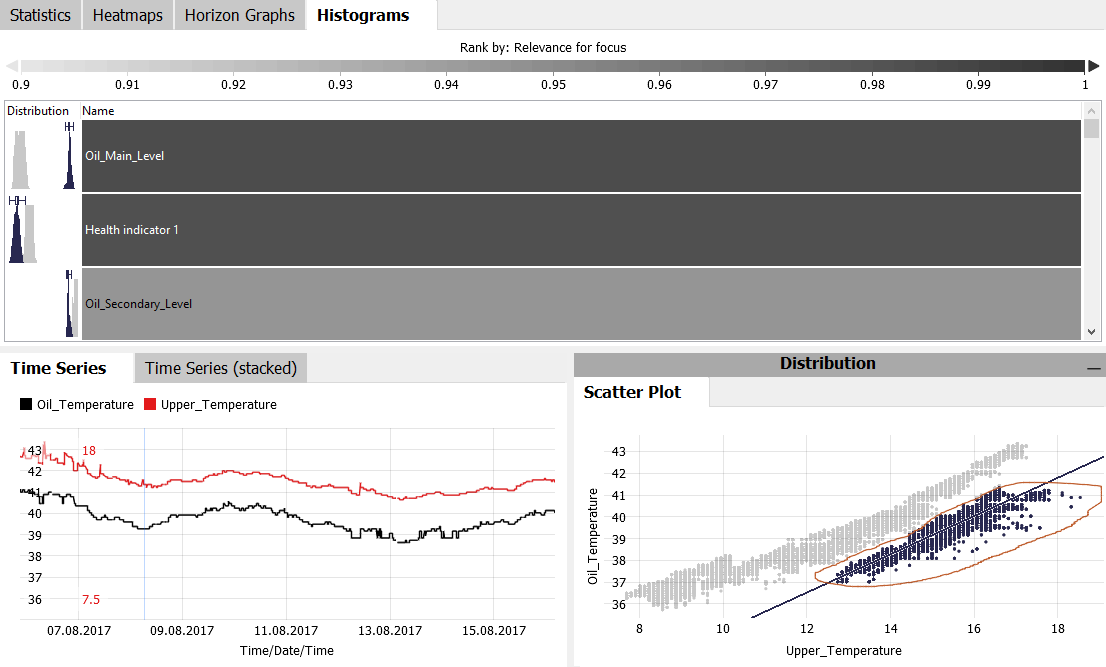
Explain anomalies by automatic search for suspicious variables.
Click Image to enlarge

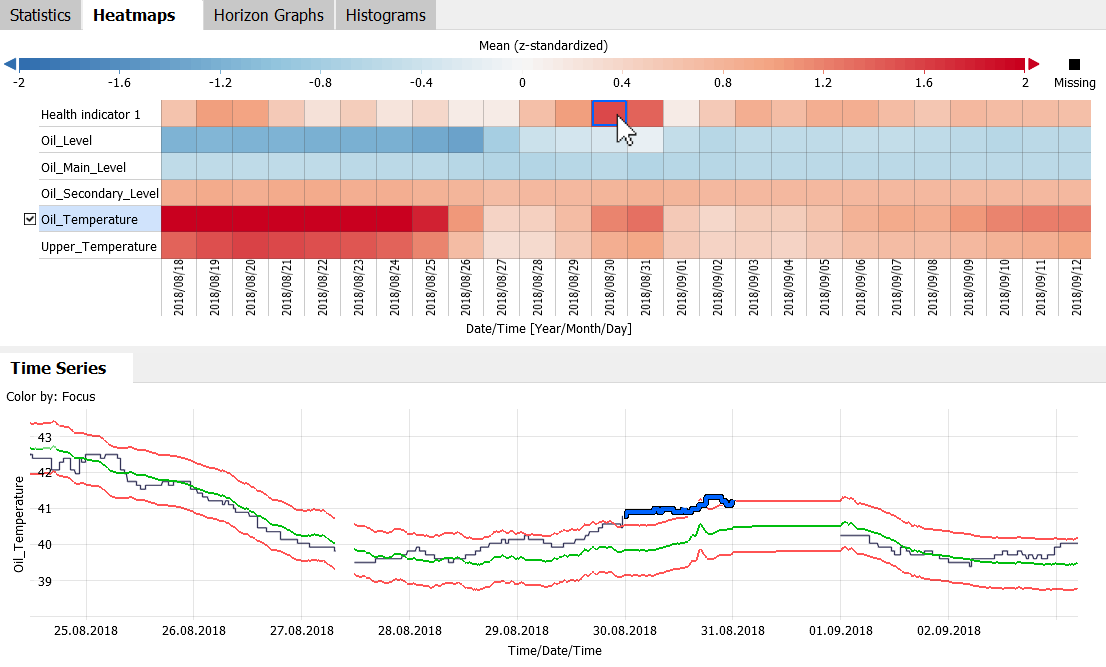
Long term overview of health index in context of other parameters.
Click Image to enlarge

If you want to learn more, or discuss an application for your individual data, feel free to book a live demo!

TROUBLESHOOT ENERGY DISTRIBUTION ASSETS WITH VISPLORE

Using monitoring data for optimizing the management of many critical energy distribution assets is a decisive factor for preventing asset failures or premature asset replacements in the energy distribution sector.

However, due to the vast amount of acquired data, it is increasingly difficult to use standard tools such as Excel for turning raw monitoring data into insights for more efficient maintenance of assets. This task not only entails the preparation and in-depth analysis of large datasets but also the calculation of health indices for each asset. In fact, understanding the root-causes of asset malfunction requires to take into account the manufacturers’ specification, operational data, as well as expert knowledge.

Visplore reduces these challenges to a minimum – and enables you to optimize maintenance with remote monitoring and data analytics much better.
Why our customers
prefer Visplore

Perfect for dirty sensor data. With Visplore, we give customers more insights for the same money.

When we need it fast, we use Visplore.

Visplore enabled us to gain significant new insights from massive data about the impact of production process parameters on product quality.

Thanks to its ease of use and high performance even with millions of measurements, Visplore has established itself as our standard tool for quality management in plants from China to South America.

Checking and cleaning data from energy systems used to be very time-consuming and kept us from our core tasks. With Visplore, data preparation has become much faster, and the quality of the resulting data has improved.

The good usability and the comprehensive visualizations enabled us to gain a deeper understanding of routinely collected data and their relationships. For example, this increased the quality of forecast models.

Visplore is recognised and in use as a central strategic software for data analytics throughout the company.

By analyzing process data from a large foundry with Visplore, complex dependencies were detected that we didn’t find with other software. As a result, our customer’s heat energy was reduced by around 5% and mold wear by around 4%.

For our thermodynamical simulations, Visplore helps us to identify suitable data, eliminate outliers, and analyze physical processes very effectively.

The visualization is fast and simple enough for live collaboration with the customers, on site. By this, Visplore supports a thorough understanding of correlations, outliers, and anomalies.

Visplore makes our analysis of sustainable energy systems much more efficient.
In addition to the performance for large data, its integration with scripting environments is a big plus.

Visplore allows for a much easier investigation of relevant patterns and structures. Our downstream analysis becomes more efficient and we gain more confidence in the results.

 
illwerkevkw

Monitor forecasts like never before.