From dashboard to root cause analysis in one click
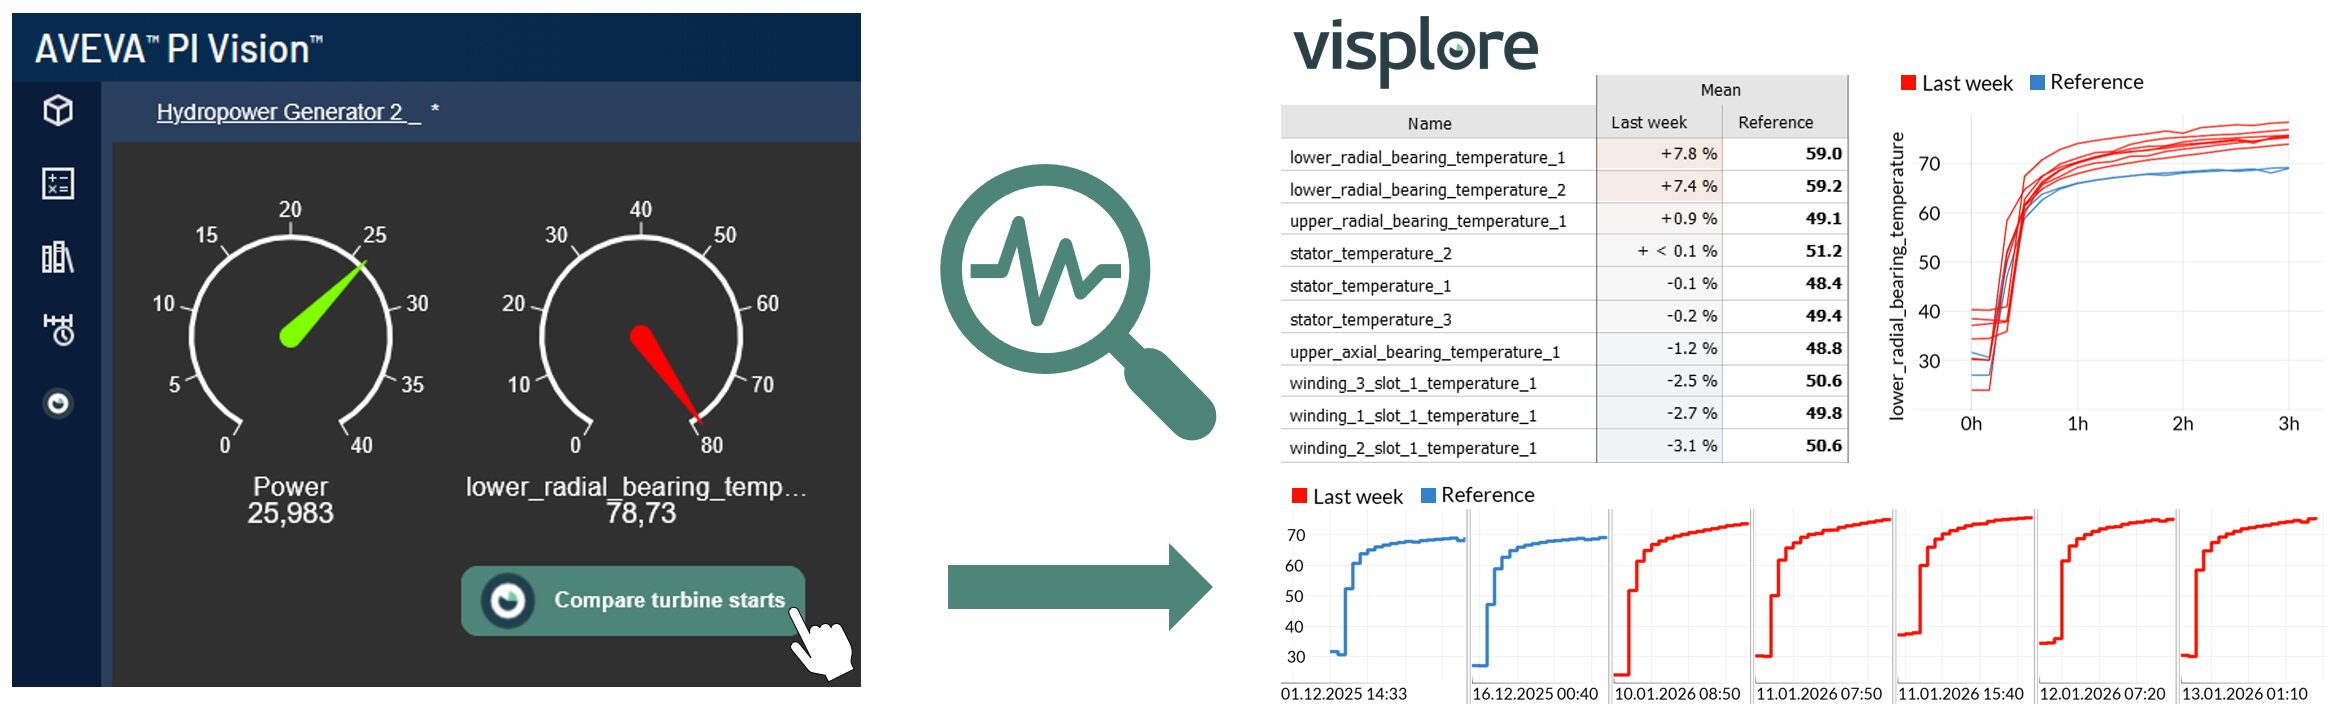
Visplore connects seamlessly to the AVEVA PI System, AVEVA Historian, and PI Vision, giving engineers a fast, intuitive way to move from PI data to deep troubleshooting.
Visplore connects seamlessly to the AVEVA PI System, AVEVA Historian, and PI Vision, giving engineers a fast, intuitive way to move from PI data to deep troubleshooting.
A frequent status quo
Visplore is the leading European software for deep, systematic root-cause analysis.
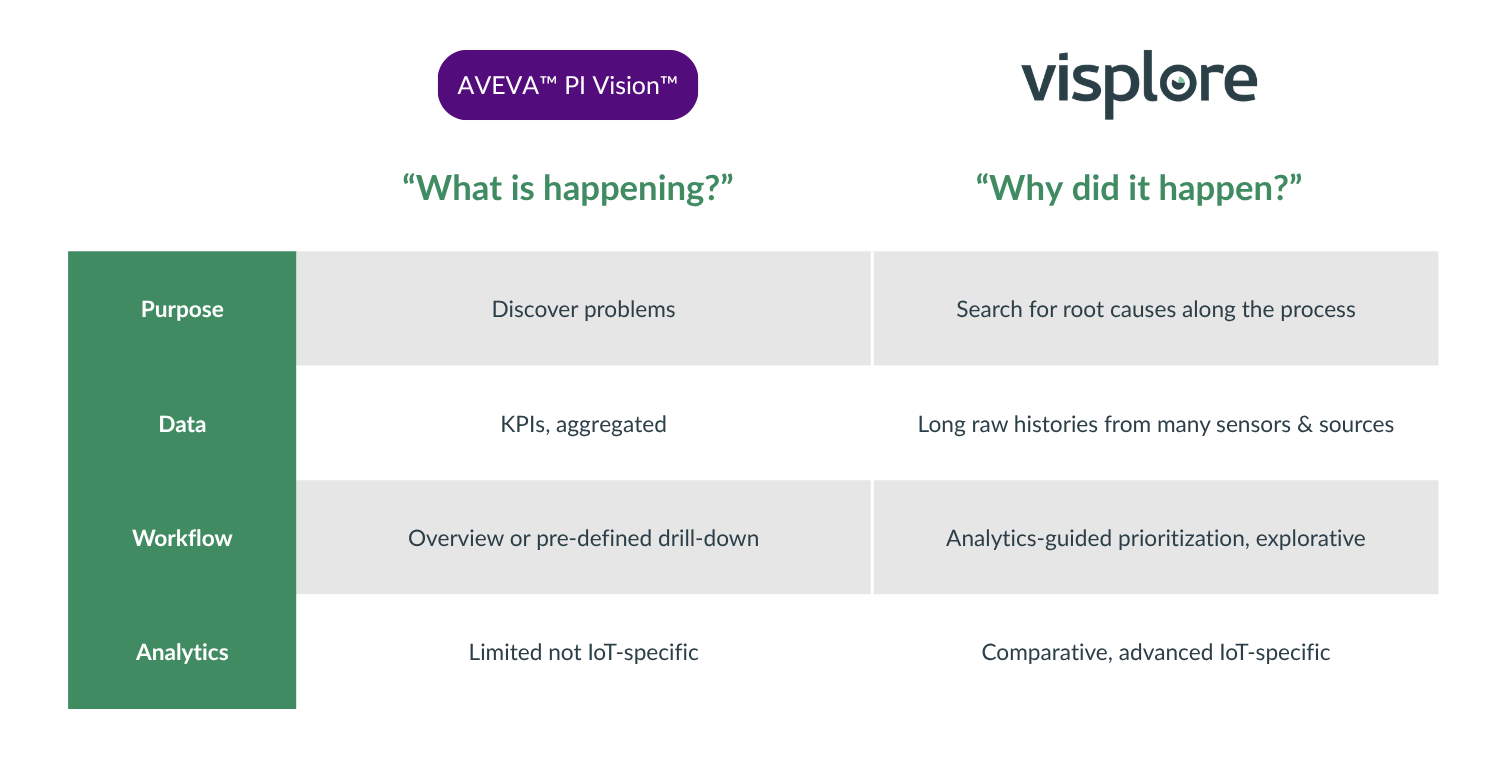
When KPIs and simple trends are no longer sufficient and action is time-critical, it complements dashboards with guided forensic “why” analyses that deliver insights for problem-solving and performance optimization. It works across your entire IT/OT landscape, from process to asset, quality, and material data. It’s easy for all engineers to use, supported by integrated AI, yet fully transparent.
A deep dive into the “why” should not require days of manual effort. Instead, it should start directly where monitoring ends. Visplore enables this transition.
faster root-cause analysis vs. investigation in Excel
until ROI for most customers
of data leaves your premises
industries served
Hafslund (Power Generation)
Hafslund cut turbine maintenance downtime by 50%, preventing €1.1M in revenue loss through standardized root-cause analysis.

Mondi (Pulp & Paper)
Mondi implemented a monitoring and reporting workflow with Visplore Automation Server, ensuring efficiency and cost savings.

Luminus (Power Generation)
Luminus accelerates troubleshooting, ensures compliance, and reduces downtimes in gas-fired power generation and district heating operations.


“Visplore enables our process engineers to analyze data from our Aveva PI Systems deeper. This provides important insights and supports more and more Mondi Sites in continuous process optimization tasks.”
Wolfgang Meyer
Head of Production Solutions,
Mondi AG

“With Visplore, we reduced the time for analyzing years of data from days to 5 minutes”
Thomas Reiterer
Head of Material Testing Leoben,
RHI Magnesita














See live how Hafslund uses Visplore from within PI Vision to standardize and accelerate root-cause analysis.
Webinar: May 7th, 2026
Point Visplore at your PI Data Archive and AF server. No data export or pipeline required.
Explore your PI AF hierarchy and select tags directly in Visplore — just as you would in other PI tools.
Visually explore trends, spot anomalies, and correlate tags — with no training required for experienced PI users.
Export insights, share analysis sessions, or link findings back to your PI Vision dashboards and reports.
Visplore directly connects to PI, lets you search for tags, browse the asset framework, and much more. But it doesn’t stop here. You can easily contextualize your analysis with data from all your other sources, sach as ERP, MES, lab measurements, and much more.
















Visplore integrates directly with PI Vision dashboards, the AVEVA PI Server, and PI AF structures. You can seamlessly jump from monitoring to visual investigation.
When a KPI drifts or alarms fire, Visplore lets you drill into years of data at once, filter by products or states, and pinpoint the root cause visually.
Use PI Vision to monitor. Use Visplore to explain. The two tools complement each other perfectly for full transparency and continuous improvement.