Time Series Exploration
with Visplore

Knowing your data is the basis for efficient and successful data science.

Explore and understand massive data in minutes – interactively!

See interactive data exploration in action

Highlights
of Visplore Data Exploration

Understand new data within minutes

Don’t spend much time building and tuning charts from scratch. Visplore’s pre-configured cockpits get you way further in no time.

See all your variables at once

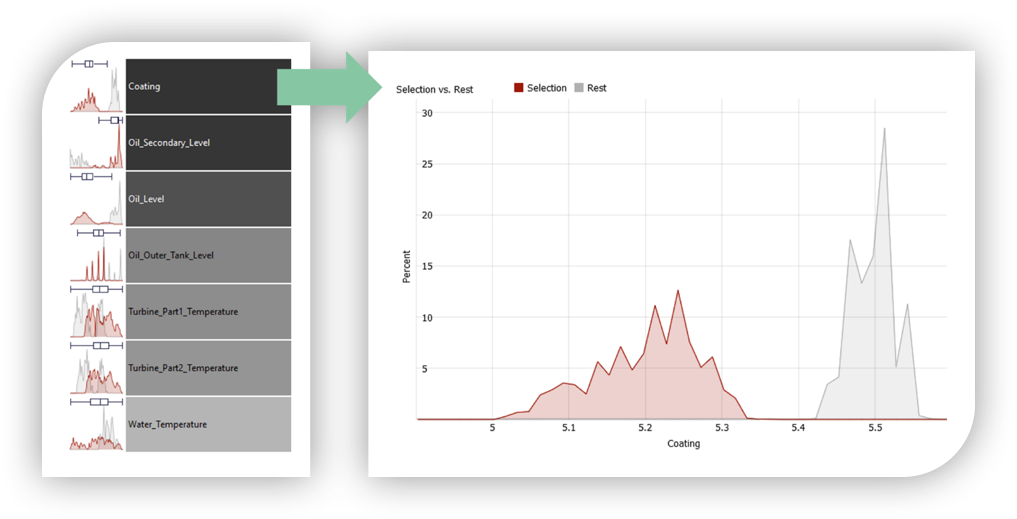
Don’t guess which variables will be relevant. Let Visplore show you. And jump seamlessly between overview and details.

Interact with millions of values

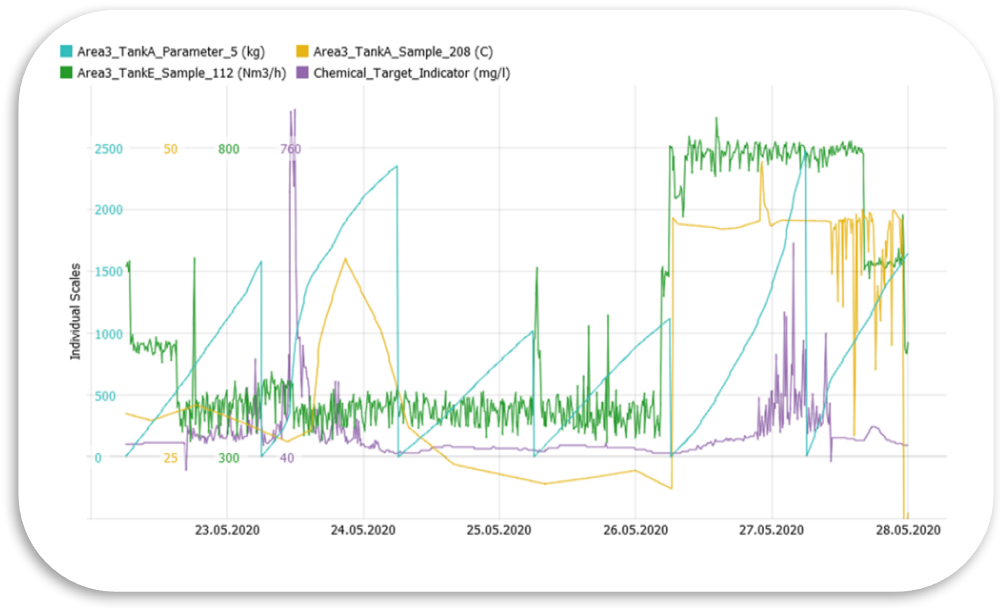
Don’t lose relevant details by pre-aggregation or filtering. Understand your data as it really is.

Solve data issues as you discover them

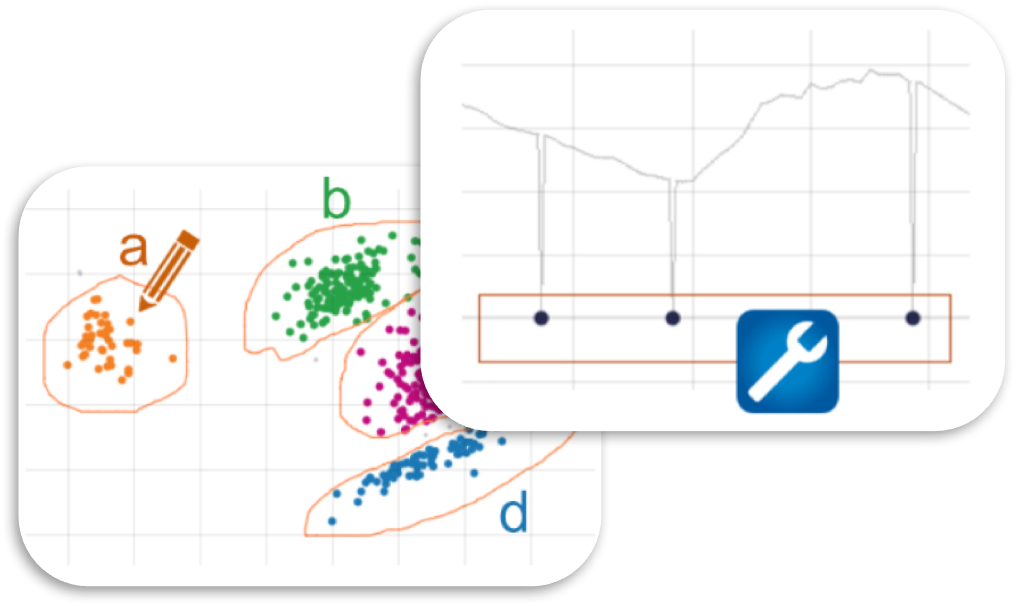
Don’t waste time for tedious cleaning of outliers, gaps, and feature engineering – do it right within the visualization and see the effect within seconds.

Explore side by side with Python, Matlab & R

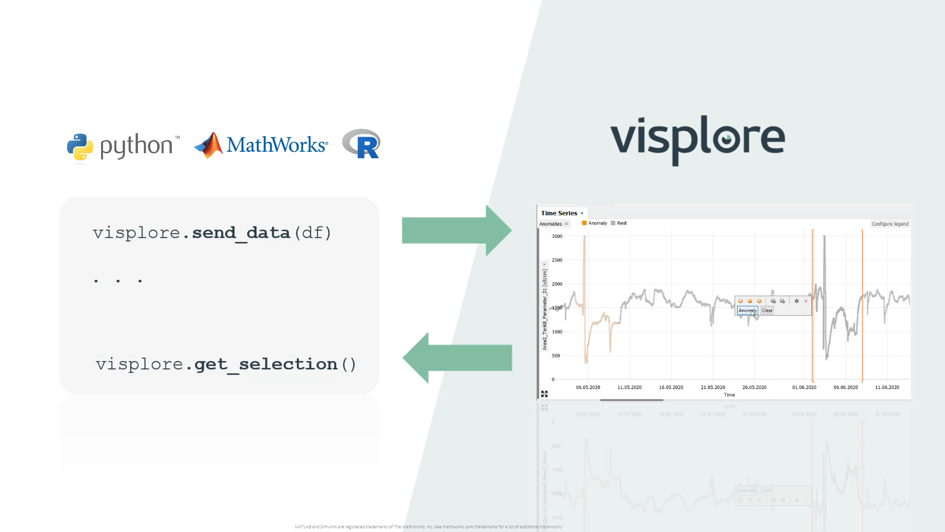
Use the right tool for each purpose. Do scripting in notebooks and data exploration in Visplore, exchanging data in both directions in just one line of code.

Learn more about Visplore Integrations

Better together – the new way of exploring data

Data exploration is not only about discovering patterns, clusters, correlations, … It’s about understanding what all this means for your data science project. This requires domain expertise.

The traditional approach

Traditionally, data exploration involves preparing charts and presenting them to domain experts. This often leads to more questions, requiring additional meetings and time.

It’s inefficient and can result in incomplete understanding about what’s really relevant!

Visplore efficient approach

Visplore answer all these ad-hoc questions on the fly, just as you sit together with the domain experts. Filtering, comparing, labeling, ranking, explaining, transforming, exporting, and way more – all it takes is a few clicks and no waiting even on massive data. The result? A more efficient workflow with a shorter data understanding phase. 

Why our customers
prefer Visplore

Perfect for dirty sensor data. With Visplore, we give customers more insights for the same money.

When we need it fast, we use Visplore.

Visplore enabled us to gain significant new insights from massive data about the impact of production process parameters on product quality.

Thanks to its ease of use and high performance even with millions of measurements, Visplore has established itself as our standard tool for quality management in plants from China to South America.

Checking and cleaning data from energy systems used to be very time-consuming and kept us from our core tasks. With Visplore, data preparation has become much faster, and the quality of the resulting data has improved.

The good usability and the comprehensive visualizations enabled us to gain a deeper understanding of routinely collected data and their relationships. For example, this increased the quality of forecast models.

Visplore is recognised and in use as a central strategic software for data analytics throughout the company.

By analyzing process data from a large foundry with Visplore, complex dependencies were detected that we didn’t find with other software. As a result, our customer’s heat energy was reduced by around 5% and mold wear by around 4%.

For our thermodynamical simulations, Visplore helps us to identify suitable data, eliminate outliers, and analyze physical processes very effectively.

The visualization is fast and simple enough for live collaboration with the customers, on site. By this, Visplore supports a thorough understanding of correlations, outliers, and anomalies.

Visplore makes our analysis of sustainable energy systems much more efficient.
In addition to the performance for large data, its integration with scripting environments is a big plus.

Visplore allows for a much easier investigation of relevant patterns and structures. Our downstream analysis becomes more efficient and we gain more confidence in the results.

 
mondi
GF
Verbund
APG
AIT - Austrian Institute of Technology
illwerkevkw

Understand massive data in minutes.

Free forever for academic/personal use