Flexible Forecast Diagnostics

Reliable forecasts of consumption and generation are critical in the energy sector.

Read here how a transmission system operator used Visplore to detect model anomalies and forecast drifts 30 % earlier and improved model accuracy by 5 %, on average.

Forecast diagnostics
Reliable forecasting with minimal effort

Visplore features a ready-to-use solution for diagnostics of all energy forecasts – from own models to forecast service providers.

  • Validate hundreds of forecasts at a glance
  • Analyze problematic periods in detail
  • Detect systematic errors automatically
  • Identify systematic deviations of forecasts
  • Compare multiple model variants
  • Select and cleanse data intuitively
  • Calculate error metrics automatically
  • Monitor very large quantities of energy producers

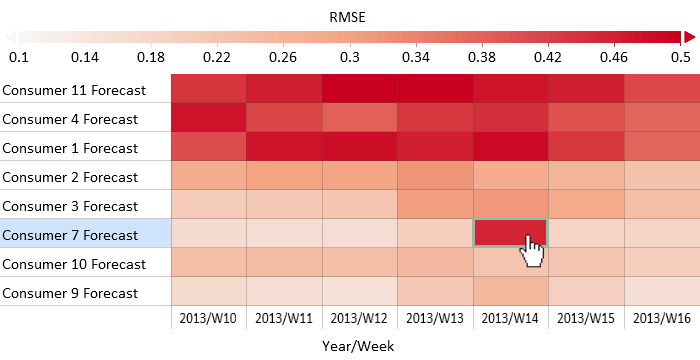
Quickly grasp the error distribution including trends and outliers of forecast models over time.
Click Image to enlarge

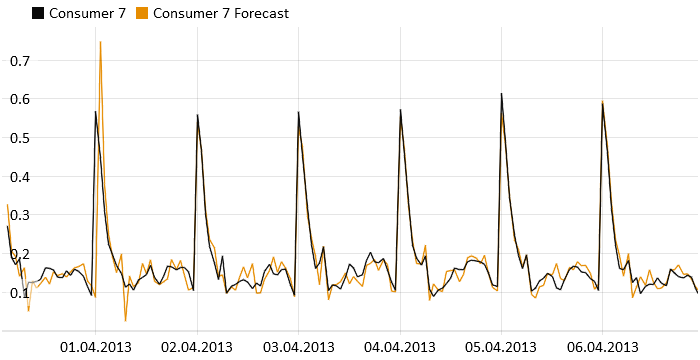
Use the “Prediction vs Reference” line plots to quickly inspect where forecast are off to a larger degree.
Click Image to enlarge

If you want to learn more, or discuss an application for your individual data, feel free to book a live demo!

Detecting forecast problems

With increasing decentralization and the expansion of renewable energy sources, the energy sector relies heavily on reliably accurate forecast models for consumption and generation. Thus, the focus of forecast monitoring and diagnostics is to swiftly detect temporary anomalies and gradual drifts across a multitude of models.

However, keeping track of an ever-expanding number of forecast models—often numbering in the thousands—in terms of quality and timeliness presents an increasing challenge. Models can quickly become outdated due to the rapid expansion of renewable energy, adding complexity to the task. It’s imperative to monitor these numerous models with minimal effort to promptly identify negative trends in forecast quality and pinpoint the underlying causes of degradation.

Visplore reduce these challenges to a minimum – and enables you to detect badly performing models and deteriorating trends much earlier.

Why our customers
prefer Visplore

When we need it fast, we use Visplore.

Checking and cleaning data from energy systems used to be very time-consuming and kept us from our core tasks. With Visplore, data preparation has become much faster, and the quality of the resulting data has improved.

The good usability and the comprehensive visualizations enabled us to gain a deeper understanding of routinely collected data and their relationships. For example, this increased the quality of forecast models.

Visplore is recognised and in use as a central strategic software for data analytics throughout the company.

Visplore makes our analysis of sustainable energy systems much more efficient.
In addition to the performance for large data, its integration with scripting environments is a big plus.

Visplore allows for a much easier investigation of relevant patterns and structures. Our downstream analysis becomes more efficient and we gain more confidence in the results.

 
illwerkevkw

Diagnose forecasts like never before.