Partnering with OSIsoft – How Visplore adds value to your PI System

Author: Harald Piringer

We are very excited to announce the partnership of Visplore with OSIsoft (part of AVEVA).
The PI System by OSIsoft is the market-leading data management platform for industrial operations. For over 40 years, industrial enterprises worldwide have relied on the PI System to store, process, and monitor data from their business-critical assets. Visplore complements these capabilities by empowering process engineers to turn PI data into compelling stories beyond standard dashboarding. This fosters a culture of data-driven decision-making and helps engineers to scale their insights with today’s increasing amount of sensor data.

OSIsoft and Visplore share the vision to transform the world through data.
Together, the comprehensive data management of the PI system and the unique exploration capabilities of time series data in Visplore ensure even better ideas for process optimization and faster root-cause analysis. The seamless technical integration provides a convincing user experience. That’s why leading enterprises such as EnBW, Mondi, and RHI Magnesita are using Visplore for getting even more value from their investments in their PI architectures.
How Visplore adds value to the PI system

By using PI, companies have chosen an excellent fundament for success in their digitization journey. However, the potential of process data goes beyond storage, alerts, and monitoring dashboards. The full value of process data is unleashed in combination with essential ingredients: Human experience, intuition, and creativity.

That’s the power of Visplore: Helping process experts to discover the unknown in their process data and turn discoveries into insightful stories based on their process know-how. Visplore is unique as the first software solution that focuses on making interactive exploration of massive process data available to non-data scientists. Specifically, this is how Visplore boosts the value from the PI system:

  • Going deeper with less effort: Visplore enables process experts to go deeper in diagnostics and root-cause analysis while staying easy-to-use and intuitive without coding. For answering the most challenging questions at the speed of sight.

  • Reducing the burden on data science: Visplore significantly reduces the dependency of process experts on data science and IT departments by empowering them to do advanced analytics themselves. This frees data science resources to really focus on advanced AI.

  • Discovering the own process: Visplore fosters unexpected discoveries by scaling analysis up to thousands of tags. Process engineers thus gain unbiased insights even without initial hypotheses, extend critical knowledge about the own process, and generate new ideas for process optimization.

  • Speeding up daily data work: Visplore speeds up routine tasks by reducing the time spent on data preparation and compiling reports, thereby reducing the 80 percent of all data projects.

  • Fostering a data-oriented culture: By sharing insights, Visplore increases the number and frequency at which process experts make use of PI data for decision making and process optimization.

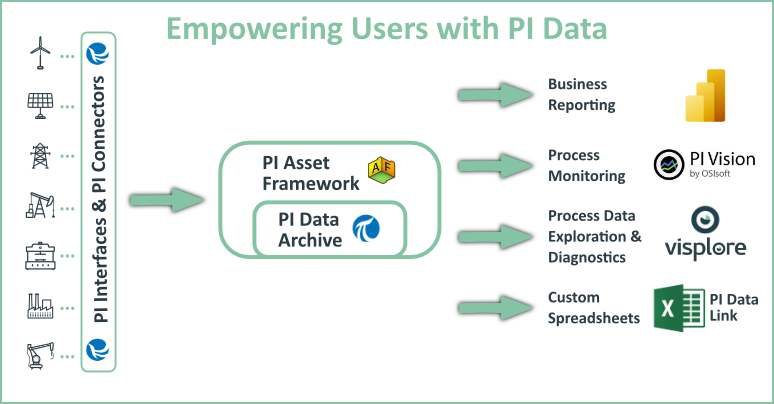
Visplore is an ideal complement to PI Vision. While PI Vision dashboards display the current process status for your most critical tags, Visplore enables an in-depth analysis of long time ranges for up to thousands of tags. This helps to find root-causes of process anomalies quickly and inspires new ideas by comparing patterns and understanding correlations. The analysis in Visplore thus begins where the monitoring in PI Vision ends – for a complete coverage of use cases with PI data.

This sketch shows how Visplore fits into the PI landscape.

What distinguishes Visplore from other analytics tools?

Visplore provides process engineers a more complete picture about what’s going on, and turns analyzing massive process data into a high-performant experience that no other analytics software delivers. Some specific highlights:

Process analytics meets business intelligence
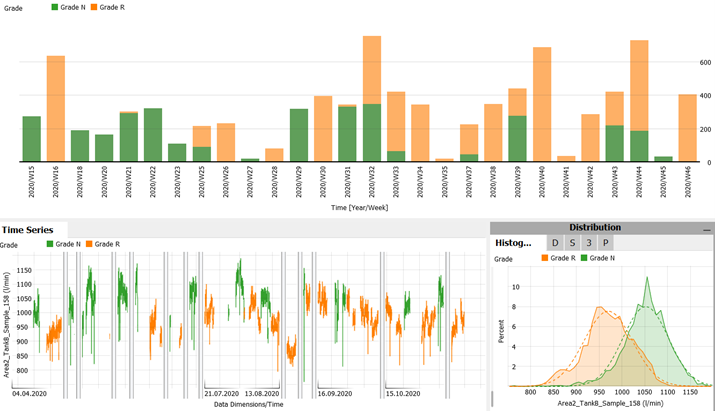
Most process visualization tools offer only limited support for categorical data, such as product types, grades, and many others. Visplore seamlessly integrates the analysis of categorical and quantitative time series by incorporating concepts from business intelligence, for example configurable pivot tables, bar charts, heat maps, and much more. This adds the necessary context to a broad range of analyses, and reduces the effort for frequent workflows by magnitudes.

The bar chart shows, which grades were produced in which week. The other visualizations compare the process behavior for a specific tag.

Comparing two grades. The bar chart shows, which grades were produced in which week. The other visualizations compare the process behavior for a specific tag.

Get the full picture of your process
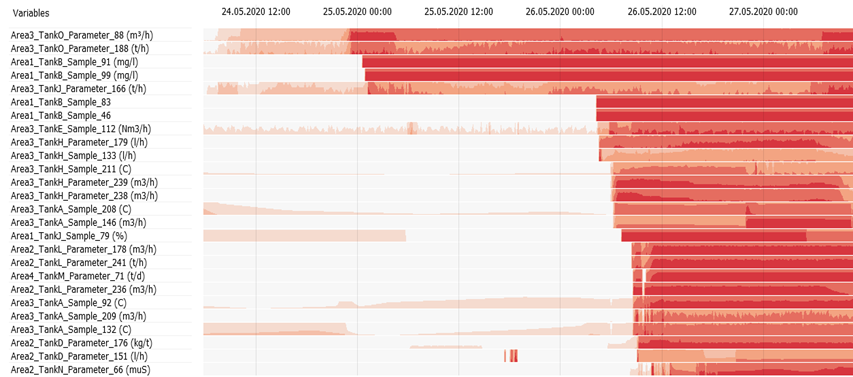
How many tags does your production process include? Thousands? Way more? Experience and intuition alone are often no longer sufficient to identify relevant tags for finding root-causes. Sometimes, it is necessary to trace events across dozens of tags. Standard time series plots do not scale well for that. Visplore offers cutting-edge visualization technology that provides the full picture  without clutter. A picture is worth a thousand words – and a good visualization can tell the entire story from root-cause to failure. This boosts the analysis as well as the communication of the process, and brings situation awareness to a new level.

Visualizing how a leap in process levels is propagating across 26 tags.

Visualizing how a leap in process levels is propagating across 26 tags.

Understand complex dependencies
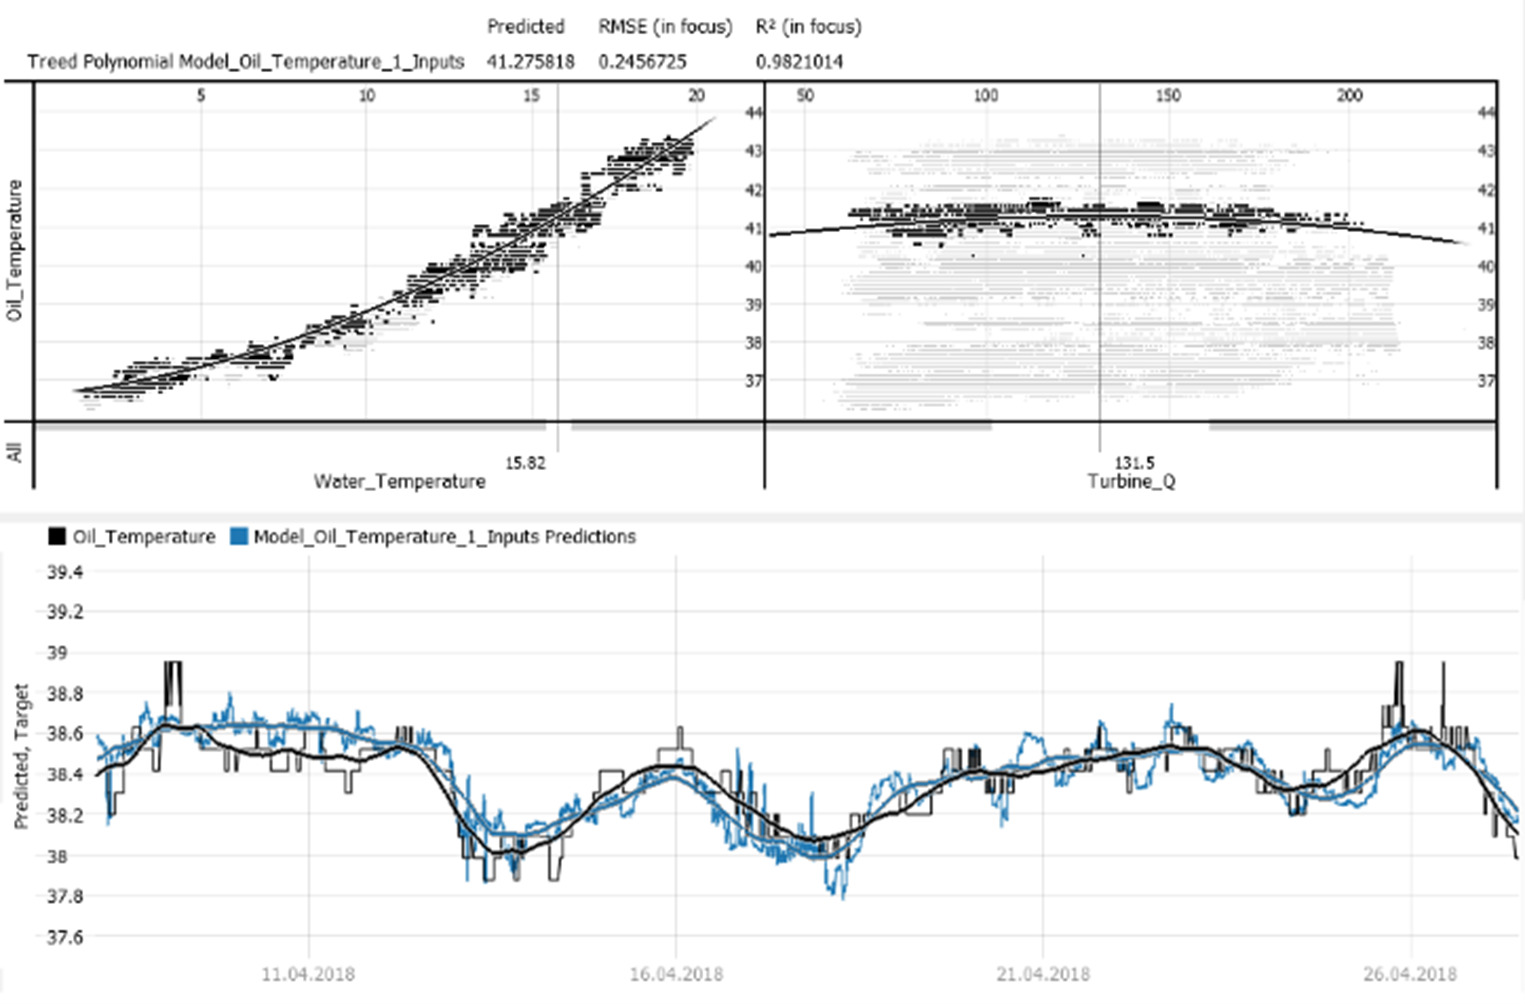
Which factors have which impact on energy consumption, yield, or product quality? And what gains could you expect by changing process settings? Effective process optimization is much about understanding complex – often multivariate – dependencies. Visplore makes it easy to identify and deeply understand dependencies. Algorithms automatically suggest potential influencing factors even for thousands of tags, and help building predictive models within minutes. Intuitive visualization then lets engineers explore what-if scenarios interactively. This way, knowledge hidden in process data from the past is made accessible for boosting the performance in the future.

Making transparent, how operation settings and environmental conditions affect an oil temperature.

Making transparent how operation settings and environmental conditions affect an oil temperature.

Data cleansing at the speed of thought
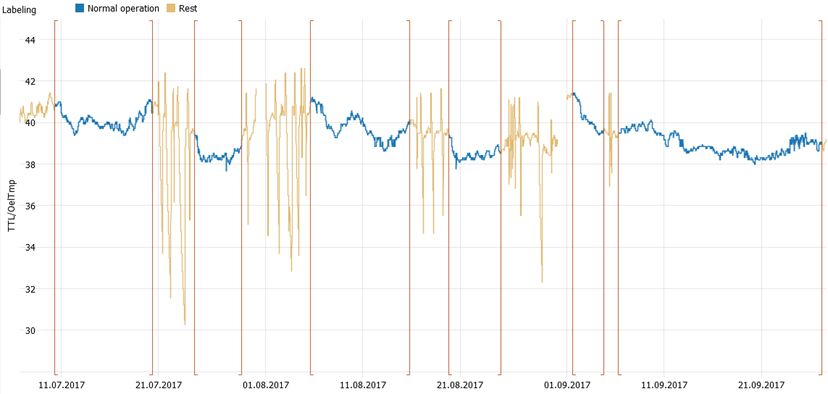
Process data can be tedious to work with. Dealing with gaps, process changes, outliers, and anomalies may cause up to 80% of the effort in data projects. That’s why Visplore integrates data visualization and data preparation. A good visualization can be the most intuitive user interface to cleanse data. In Visplore, users can select, filter, replace, modify, segment, … data directly within the visualization – just-in-time when discovering it. This integration speeds up data preparation, boosts creative analyses rather than interrupting them, and ultimately ensures that results are based on validated data you can trust.

Selecting and labeling multiple periods of normal process operation (blue) for downstream analytics.

Selecting and labeling multiple periods of normal process operation (blue) for downstream analytics.

Bridging the gap between process, quality, and contextual data
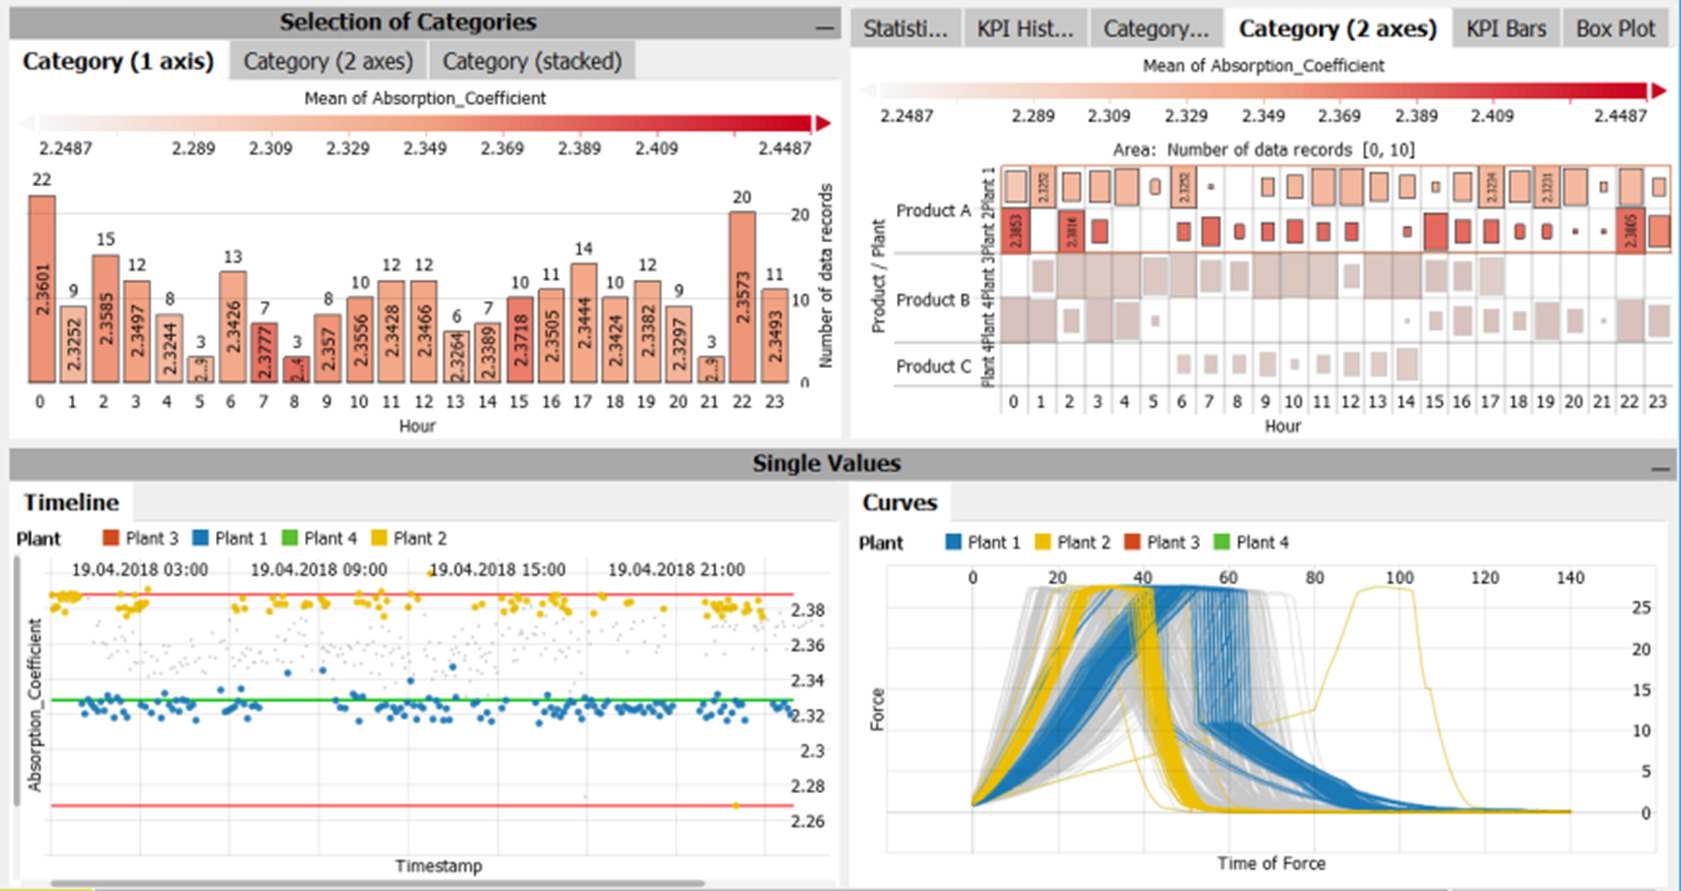
Sometimes, continuous process data alone will not answer your question. Perhaps your analysis focuses on discrete samples from quality measurements, or recurring profiles from batches or machine signatures. Visplore goes far beyond continuous time series data, offering integrated views on discrete data, tolerance limits, continuous profiles, contextual data, and much more. This makes Visplore a versatile analytics tool that can be applied to numerous application domains – from process development and process engineering to quality assurance and maintenance.

Comparing machine signatures from multiple plants (bottom right), together with quality measurements (bottom left) and contextual data such as the product produced (top right).

Comparing machine signatures from multiple plants (bottom right), together with quality measurements (bottom left) and contextual data such as the product produced (top right).

Accessing the PI System from Visplore

From a user perspective, accessing the PI System is easy and directly integrated in Visplore Professional. In addition to tag search capabilities, users can query data via their Asset Framework for any time range. During the analysis, additional tags can always be added and the inspected period can be adjusted. Optionally, Visplore automatically streams the latest live data. Moreover, it only takes a single click to open customized standard analyses for the latest data. This way, process experts can take advantage of the comprehensive interactive analysis in Visplore with minimal training time.

In a nutshell

Visplore helps companies to get even more value from their PI System by empowering process experts to do deeper analytics at much less effort. This perfectly complements PI Vision for situations that require engineers to dive deep and get the full picture of numerous tags – including categorical attributes. Visplore thus fosters a data-oriented culture, where the joint power of advanced analytics and human process experience boost root-cause analysis and process optimization.

As exhibitor at the AVEVA PI World 2022 in Amsterdam, we are very much looking forward to meeting you in person! We are glad to show you, how your team can benefit from Visplore for your PI data!

If you don’t plan to attend, request a live demo call today!

Further readings

About the author

Harald Piringer studied informatics at the Vienna University of Technology and finished his PhD in 2011. For more than 10 years, Harald Piringer was the head of the Visual Analytics group at the VRVis research center in Vienna / Austria, where he did applied research in close collaboration with partners from industry, energy, healthcare, and other sectors. Harald Piringer (co-)authored more than 30 international publications in the fields of data visualization and visual analytics. In 2020, he co-founded the Visplore GmbH as its CEO.

Newsletter

Stay up to date on new developments around Visplore. Subscribe to never miss new blog posts!