How to label time series efficiently – and boost your AI

Author: Harald Piringer – August 30, 2021

Data labeling is a critical step in building high-quality AI models. This blog introduces the topic with a focus on time series labeling and explains how Visplore can significantly speed up the labeling process while offering a great user experience even for massive sensor data.

Note: to see the labeling workflow in Visplore in action, please refer to this short video overview.

Watch the video recording of our free webinar from Thursday, September 30, 2021. Our experts will show you in depth how Visplore can help you to label sensor data efficiently.
What is data labeling?

The increasing digitization of machines and production processes opens up many exciting possibilities. A key use case is detecting situations during machine operation from sensor data by artificial intelligence (AI). Applications range from early detection of problems to identification of different operating states. For example, a machine manufacturer may warn its customers way ahead before problems occur (“predictive maintenance”). The manufacturer may also be interested in learning which operations the customer performs with the machines in order to optimize its business offerings.

In order for an algorithm (e.g. the AI) to recognize meaningful states from raw sensor data, the information about the states must be explicitly available. Therefore, the AI needs information such as: State A occurred from 3:10 to 3:17 and from 5:23 to 5:35, State B occurred from 7:28 to 8:11.

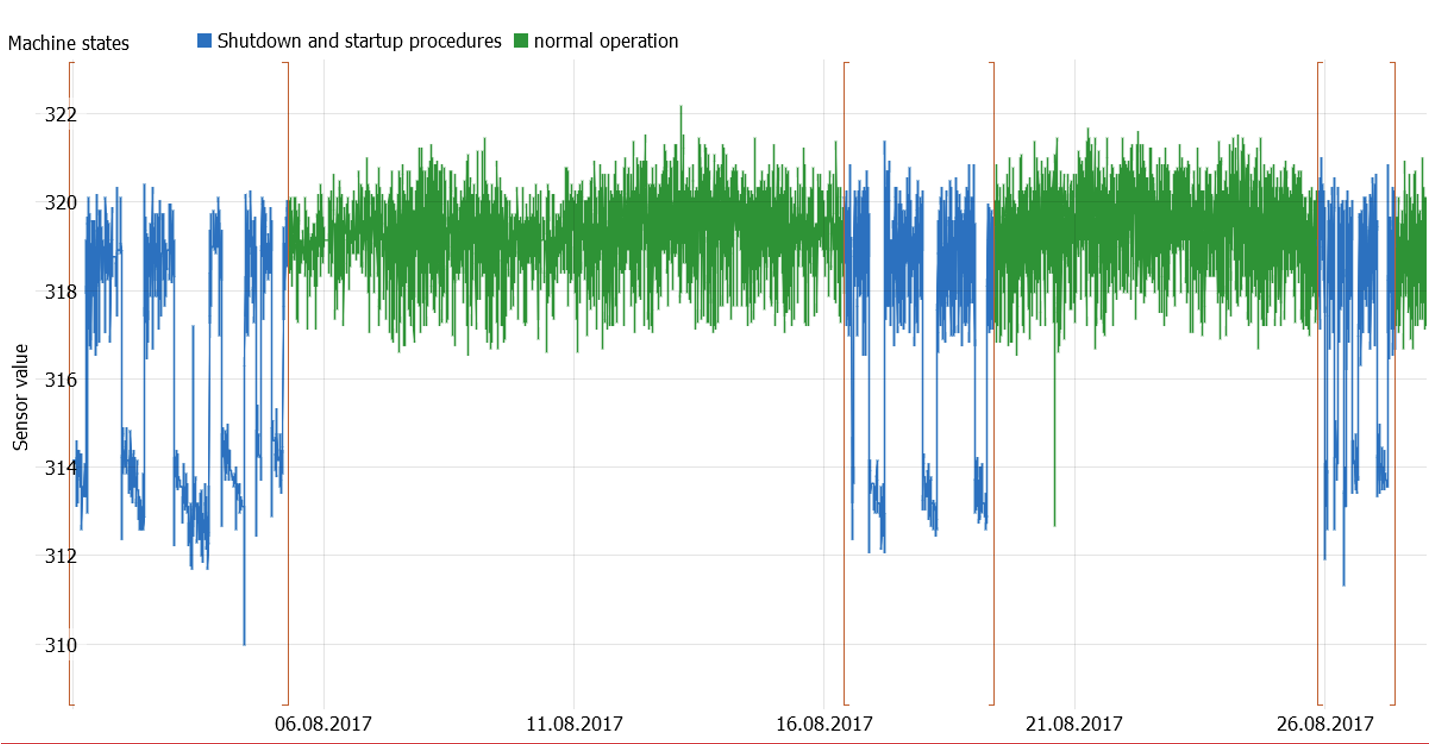
In many cases, the information about these states is not explicitly available in the raw data, but must first be generated before training the AI model. This process is called data labeling. The goal of labeling is thus to make information about distinguished classes (such as machine states) explicit. This information can then be used to train an AI model for the automatic distinction of the states. The following image illustrates a machine time series where two states have been distinguished via labeling (orange intervals), namely normal operation (green) as well as shutdown and startup procedures (blue).

Machine time series where two states have been distinguished via labeling, namely normal operation, shutdown and startup.

A special case of labeling is the selection of appropriate input data. For example, unsuitable input data such as interruptions of the machine operation should be excluded before training any model on the data. This selection can also be considered a kind of labeling.

Boost your labels for boosting your AI

The quality of the input data is one of the most essential factors for building good AI models (and machine learning models as a whole). In many cases, an AI algorithm does not detect implausible data on its own, but relies on the quality of its data preselection and the quality of its labels. Optimizing the quality of input data is thus one of the most effective ways to improve AI models. Conversely, inappropriate input data – and specifically wrong class labels – can lead to poor models and misclassifications in the subsequent application.

Getting good labels requires domain expertise

There is an increasing number of frameworks for automatizing many steps of the creation of AI models (AutoML), for example the selection of suitable model parameters through meta-modeling. However, the labeling of data is a step that inherently requires human knowledge. In rare cases, where labels can sufficiently be described based on formal rules, one can question whether the training of an AI model is necessary at all.

In many practical cases, very specific knowledge about the domain and the characteristics of the input data is required for data labeling. In a complex industrial process, only the process experts can typically interpret patterns in the sensor data and check them for plausibility. In order to correctly label recorded sensor data from machine operation, external recordings such as videos and logs may be necessary. For these reasons, data labeling is often only possible by a narrow circle of experts. The time required for labeling by precious process experts can thus become a significant cost factor of a data science project.

A different, more technical challenge is the typically large amount of sensor data that needs to be labeled. Machine sensor data has often high-frequency patterns. The expert labeling the time series must therefore be able to visualize the data at high resolution in order to avoid losing important details. At the same time, a good user experience in data labeling requires smooth and time-efficient interaction with this large high-resolution data.

Approaches to data labeling

Data labeling is a process. At the beginning, it must be clear for what purpose the data is to be labeled. Moreover, it is helpful if the raw sensor data has already been processed to some degree. For example, many algorithms for pattern search require the data from multiple sensors to be given at common, regular time steps. For the actual labeling, there are different procedures that depend on the particular case.

Manual labeling: In this case, the user manually assigns labels to specific time periods, for example by annotation in a time series display (as shown in the image above). This can be the most efficient procedure if the number of time periods to be labeled is rather small, for example process states that remain constant for a long time. Furthermore, manual labeling can also be necessary if the patterns to be labeled vary strongly, so that approaches for semi-automatic labeling would not be possible or efficient.

Semi-automatic labeling: In this case, labels result from an interaction between human and algorithm. One approach is based on pattern search. After labeling one occurrence of a certain pattern, similar patterns can be searched automatically and suggested to the user for labeling. The role of the human expert is thus to correct and supplement these suggestions. In some cases, it can also be possible to roughly characterize a class via a simple rule as a starting point for manual inspection and correction.

A special case of a two-staged labeling approach can be when the initial suggestion comes from a human. For example, a less process-savvy employee could do an initial labeling that is audited and fine-tuned by an experienced but time-limited process expert. In particularly important projects, it can also make sense to have data labeled by different people independently of each other in order to finally obtain an overall optimal labeling result by comparing the agreement.

Time series labeling in Visplore

Visplore offers specific features to label large sensor data easily and supports an efficient labeling workflow in many ways.

  • The labeling can be started directly from Python, Matlab or R on corresponding data frames (e.g. Pandas data frames in Python).
  • A new labeling with any number of classes can be created in Visplore at any time and used for visualization and analysis like any imported categorical data attribute. Alternatively, imported categorical data attributes can be used as a starting point for auditing or fine-tuning their labels.
  • With a single click, patterns in the time series display can be selected and labeled. Previous labels can be corrected just as easily.
  • The high-performance visualization supports smooth labeling of sensor time series with several million sample values.
  • Any visualization type can be used for interactive labeling. For example, you can interactively label clusters in scatter plots or peaks in histograms. This provides initial labels very fast.
  • Labels can be defined based on integrated formulas or scripts and manually corrected afterwards.
  • In Visplore Professional, a pattern search feature enables to label all occurrences of a selected patten very efficiently.
  • Powerful tools allow for comparing multiple labeling results in depth, e.g. to see when and how they differ.
  • Label definitions can easily be shared with colleagues and applied to new data.
  • The results of the labeling process can be retrieved directly from Python, Matlab, and R using a single line of code. Alternatively, they can be copied and pasted to Excel or exported as CSV.

Use Case Example

Let’s have a look at a specific example to illustrate how Visplore can enhance the labeling of sensor data in practice. In this use case, the data is a few months of sensor time series from a cooling system in a manufacturing plant. The maintenance department had recurring problems with bacterial infestations and wanted to predict such events in the future based on the data from sensors for temperature, pH value, and conductivity.

Step 1: The data scientist prepares the data as a data frame in Python, Matlab, or R and transfers it to Visplore via the send_data command.

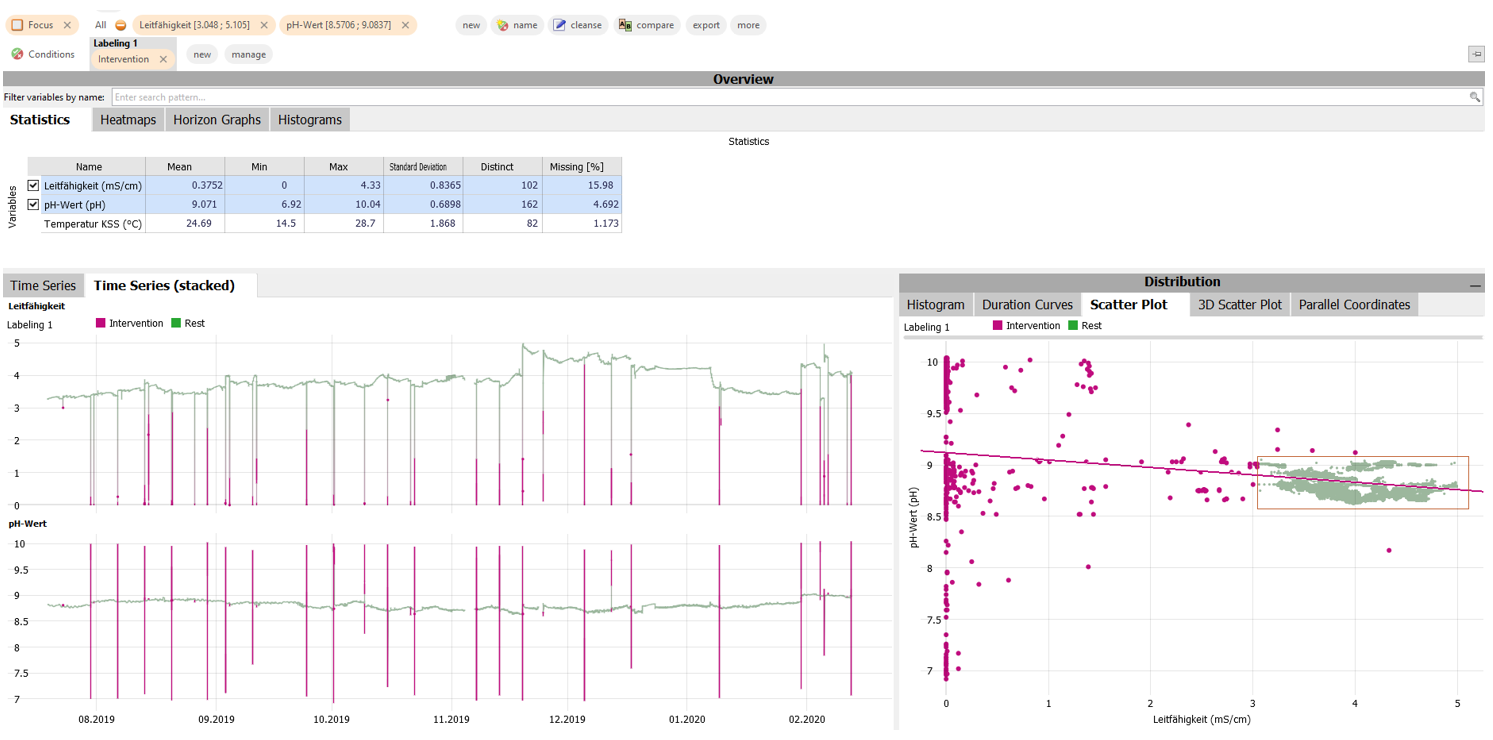
Step 2: An initial look at the sensor time series shows frequent spikes in conductivity and pH value due to recurring process interventions. These interventions should not be used as training data. An efficient way to label all interventions at once as “process intervention” is by selecting the normal value ranges in a scatter plot of the variables conductivity and pH value. This selection can be named using a click on the “name” button and used as the first label of a new data attribute resulting from the labeling process.

Sensor time series shows frequent spikes in conductivity and pH value due to recurring process interventions.

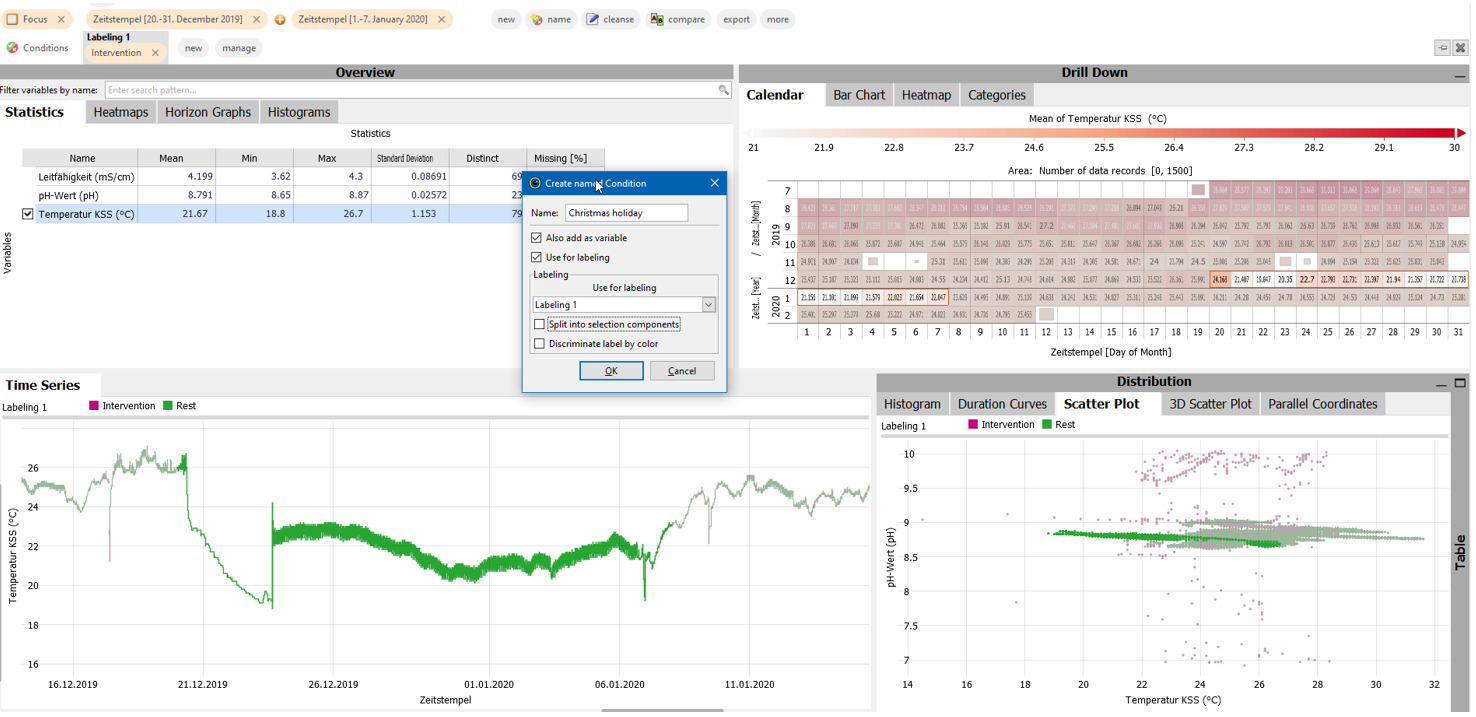
Step 3: Likewise, the data scientist labels “Christmas holidays” in the calendar visualization as it shows a distinct temperature drop and should not be used for training the model either.

Data scientist labels "Christmas holidays" in the calendar visualization as it shows a distinct temperature drop.

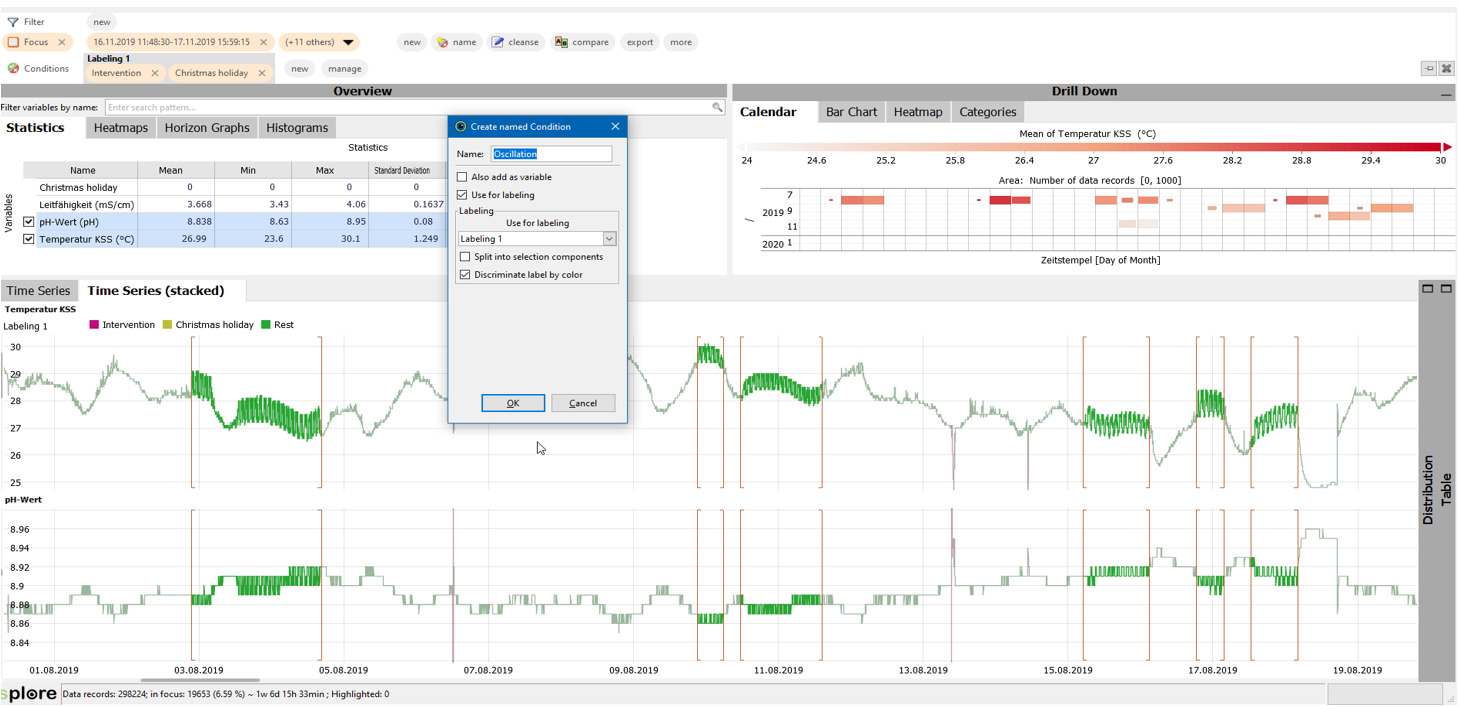
Step 4: Careful inspection of the time series shows periods with distinct oscillations of the temperature. It is not immediately clear if this data can be used for training the model. In order to discuss this finding with the process expert later on, the data scientist defines a new label “oscillation” and assigns the label directly in the time series plot by mark-up of the affected periods.

Careful inspection of the time series shows periods with distinct oscillations of the temperature.

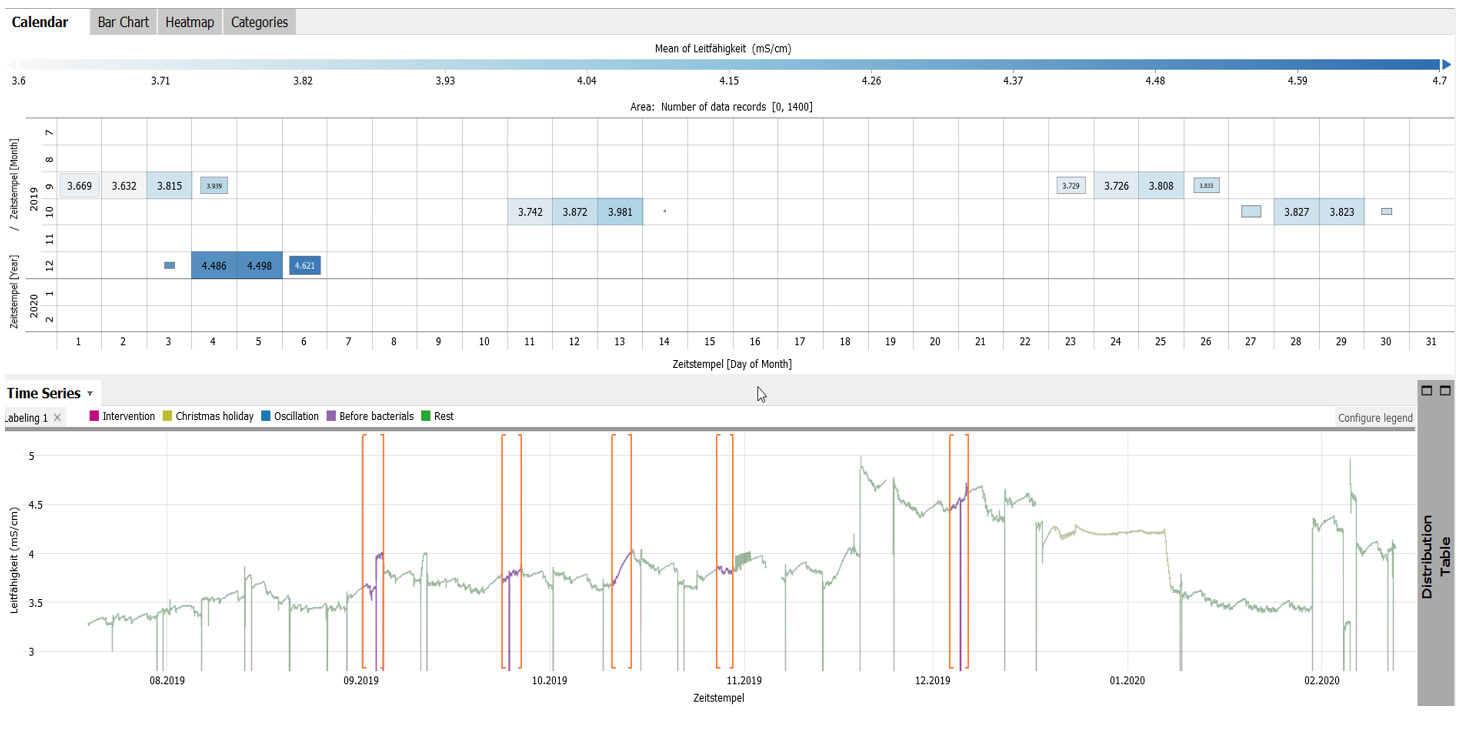
Step 5: A few days later, the data scientist continues the labeling process together with a maintenance expert. Based on logs, they label periods of three days before each bacterial infestation in the calendar and label them “before infestation”.

The data scientist and the maintenance expert label periods of three days before each bacterial infestation in the calendar.

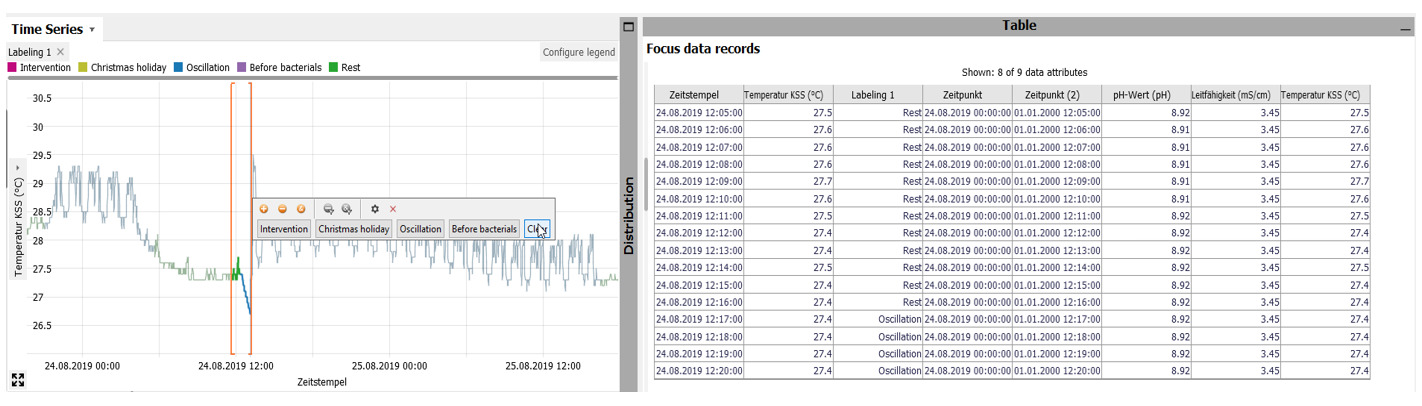
Step 6: Together, the data scientist and the maintenance expert discuss and fine-tune the labels for process interventions and decide to exclude the oscillating periods.

Together, the data scientist and the maintenance expert discuss and fine-tune the labels for process interventions.

Step 7: The data scientist is now ready to use the labeling for building the AI model. She fetches the labeling result from Python (or Matlab or R). Excluding the process interventions, the oscillations and the Christmas holidays, an AI model can be trained on the remaining data to classify situations labeled as periods before the bacterial infestations.

Please note: Even Visplore Free provides all functionality needed for this labeling use case!

Conclusion

Careful data labeling is one of the most effective ways to optimize AI. It’s one step in the creation process that inherently requires the knowledge of human domain experts. This can make good labeling an expensive and time-consuming process.

Visplore offers extensive possibilities for manual and semi-automatic labeling of massive time series such as sensor data from machine operation. The variety of visualization types in Visplore allows for an integrated process of data exploration and data labeling while the performance ensures a great user experience also for millions of sample values. The integration with Python, Matlab and R enable a seamless workflow where these environments can be used for initial data processing and model building. Altogether, doing the data labeling in Visplore saves much time and enables domain experts to bring in their knowledge for optimal results.

Note: Master time series labeling in Visplore with this interactive usecase tutorial.

Additional Information

On Thursday, September 30, 2021, our co-founders Harald Piringer and Thomas Mühlbacher hosted a 45-minute webinar covering:

  • What time series data labeling is and why it is a key success factor for AI
  • Why time series data labeling can be a significant cost factor of data science projects
  • Approaches to data labeling
  • Examples: Manual labeling of sensor data (incl. Python Integration), Automated labeling, Auditing labelled data
  • Relating data labeling and visual exploration
  • About Visplore
  • Q&A Session

This webinar did not only give deeper insights into how to use time series data labeling for sensor data but also aimed to answer all upcoming questions.

If you are also interested, use the button below to watch the webinar video recording.

About Harald Piringer

Harald Piringer studied informatics at the Vienna University of Technology and finished his PhD in 2011. For more than 10 years, Harald Piringer was the head of the Visual Analytics group at the VRVis research center in Vienna / Austria, where he did applied research in close collaboration with partners from industry, energy, healthcare, and other sectors. Harald Piringer (co-)authored more than 30 international publications in the fields of data visualization and visual analytics. In 2020, he co-founded the Visplore GmbH as its CEO.