Defining new conditions
Use conditions to filter and enhance your data. Conditions are parts of data that you interactively select. Alternatively you can define a condition through a formula. Finally, you can visualize and export your conditions for further use, as well as use them during your analysis.

Preparation (to follow this lesson using demo data)
For the tutorial, load the solar power demo dataset from the welcome dialog, as shown below.

Naming a selection
In case you want to "keep" a relevant selection you can save it as a category. This allows you to load it as your focus again at a later time (and more).
1. Select the time series "Temperature_Outdoor_BrightCounty_Weather" in the "Statistics" view by clicking on its name.
2. Then select the "vertical 1D interval brushing mode" as "selection mode" in the "Time Series" panel menu
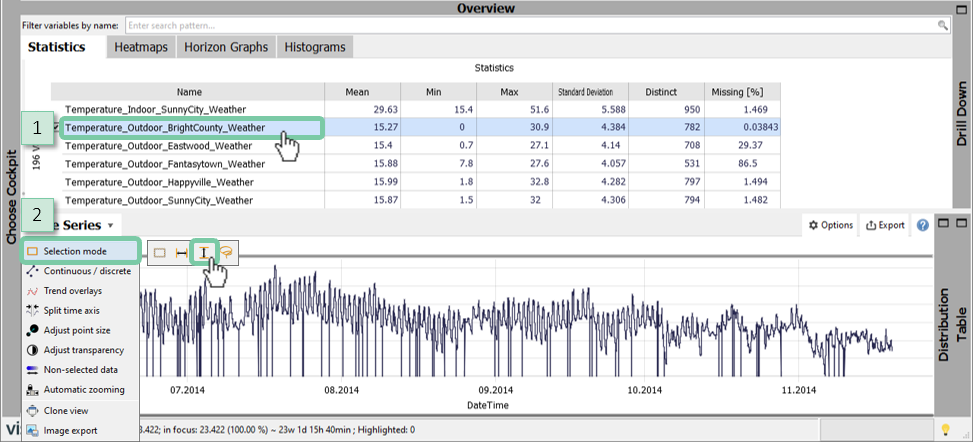
1. Perform an interval selection in the "Time Series" panel by drawing a box.
2. Refine the selection if you want by clicking on the selection next to the focus (alternatively click on the gear button next to the selection).
3. Create a named condition and enter the name "Below 2°C" in the following dialog.
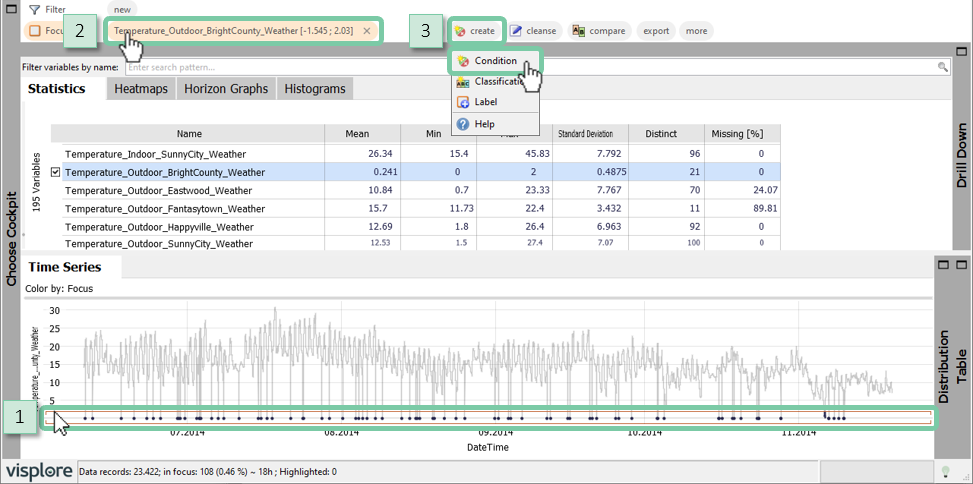
Note: you can create a condition from any selection (also in the other panels). This selection can also be options within a category, or for example using the lasso selection in the scatter plot as shown below.
Naming outliers with a free selection
Use the lasso selection to select and name outliers quickly.
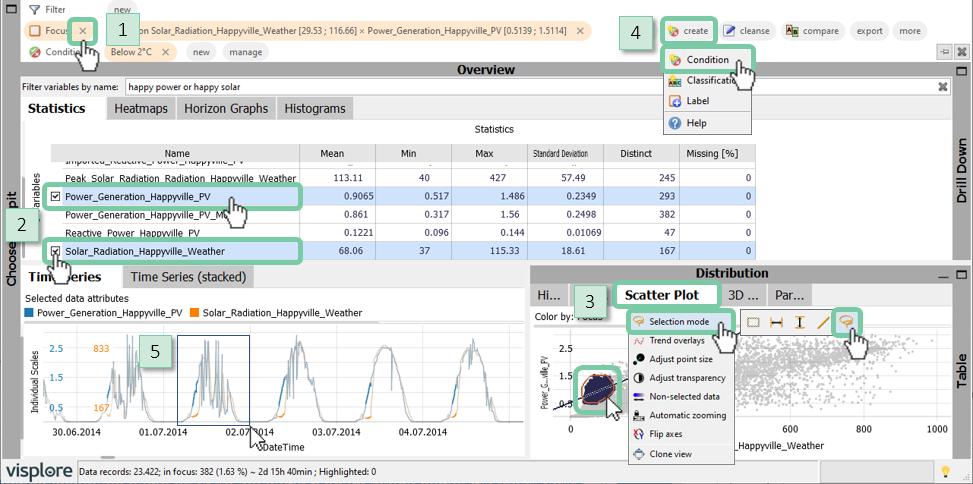
1. Clear your focus. Notice that your category will still be available and can be used to get the cleared focus back.
2. Select "Solar_Radiation_Happyville_Weather" and use the tickbox to also select "Power_Generation_Happyville_PV" (it is helpful to use the filter "happy power or happy solar").
3. Open the scatter plot, select the "lasso brushing mode" and perform a lasso selection as shown below.
4. Name condition as "Unexpected operation" (we don't expect PV production without corresponding solar irradiation!)
5. Optionally zoom in to "Time Series" with right mouse button in highlighted areas to see what is going on in detail.
Defining conditions with min/max duration
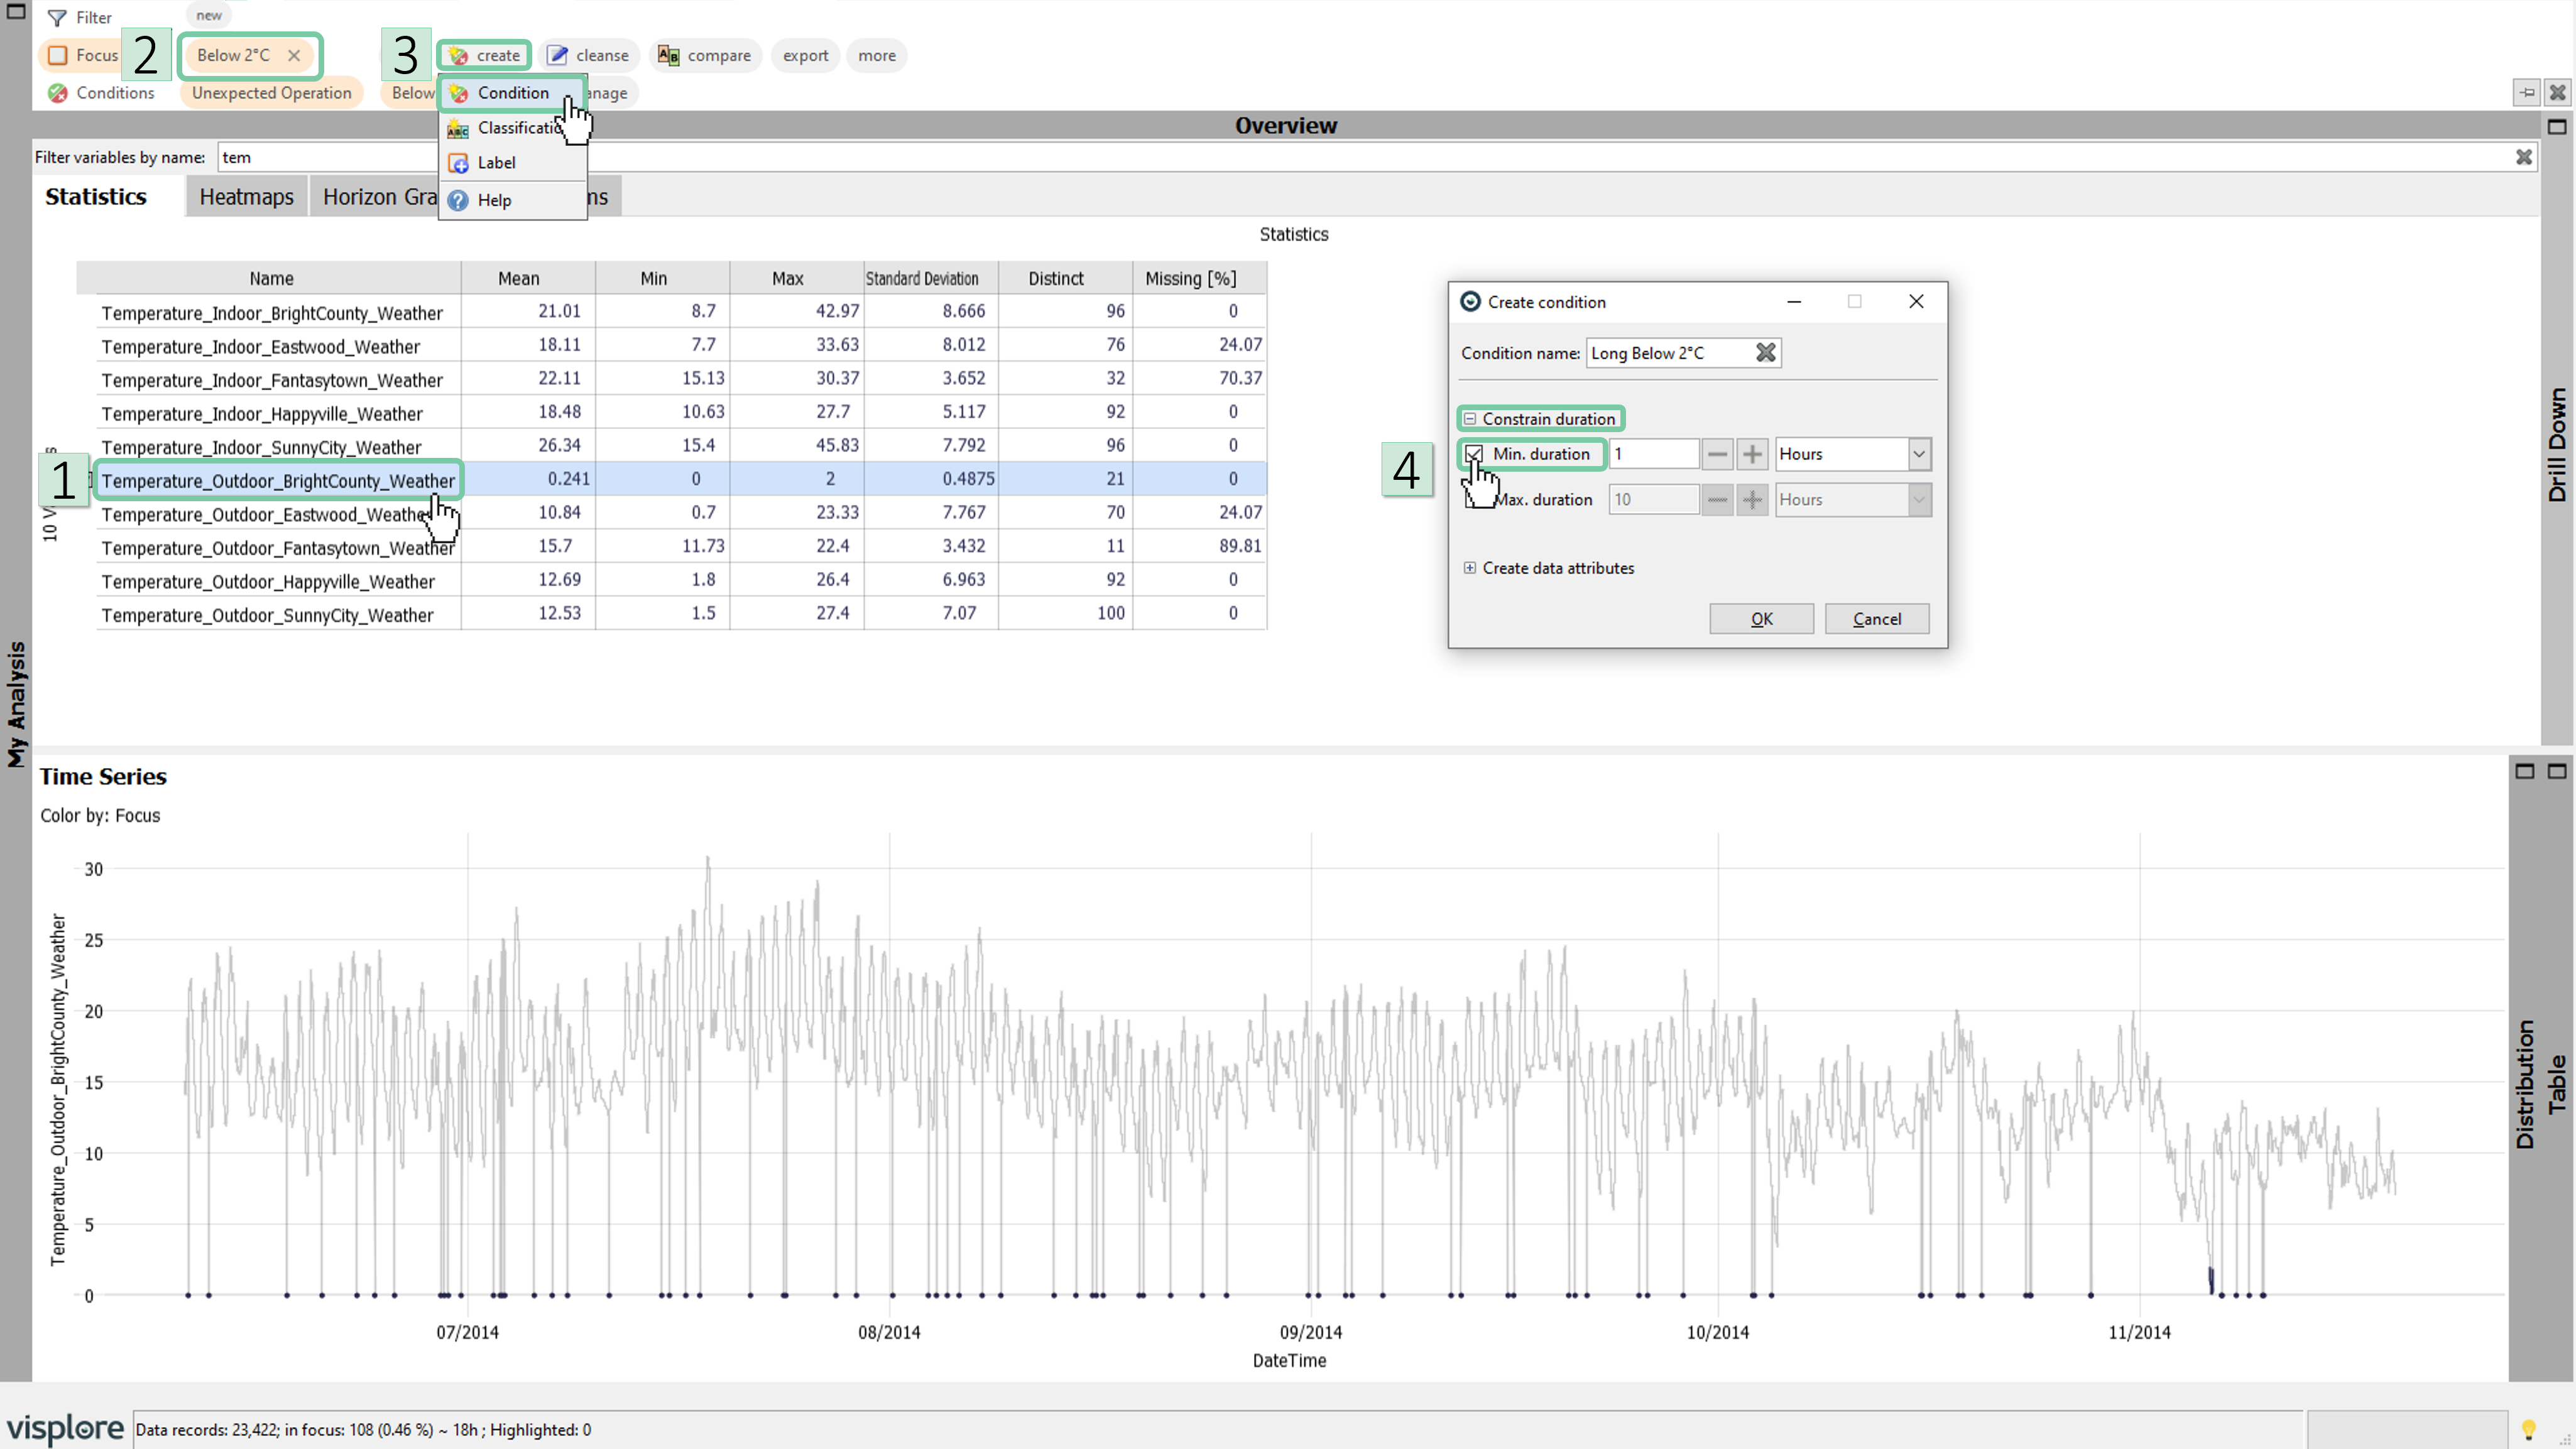
If you want to remove short periods or individual data points in your condition that are not of interest to you, you can restrict your condition with a min/max duration. In the following example we only want to see periods where the temperature was below 2°C for longer than one hour.
1. Make sure you have only "Below 2°C" in your focus. If you do not, clear your focus, click on the category "Below 2°C" and select "Put in Focus".
2. Create a new named condition called "Long below 2°C".
3. Expand the dialog by clicking “Constrain duration” and set the minimum duration to 1 hour. You will see how the individual data points from the previous selection disappeared and one longer period remains.
Defining conditions from a formula
Use a formula to select/label subsets of your data records. Think of it as scripting a (database) query, like "select all data where time series X is below time series Y", for example. Then, these conditions can be used in the analysis - for example, to see how often the condition occurs, and how it is distributed across categories or time.
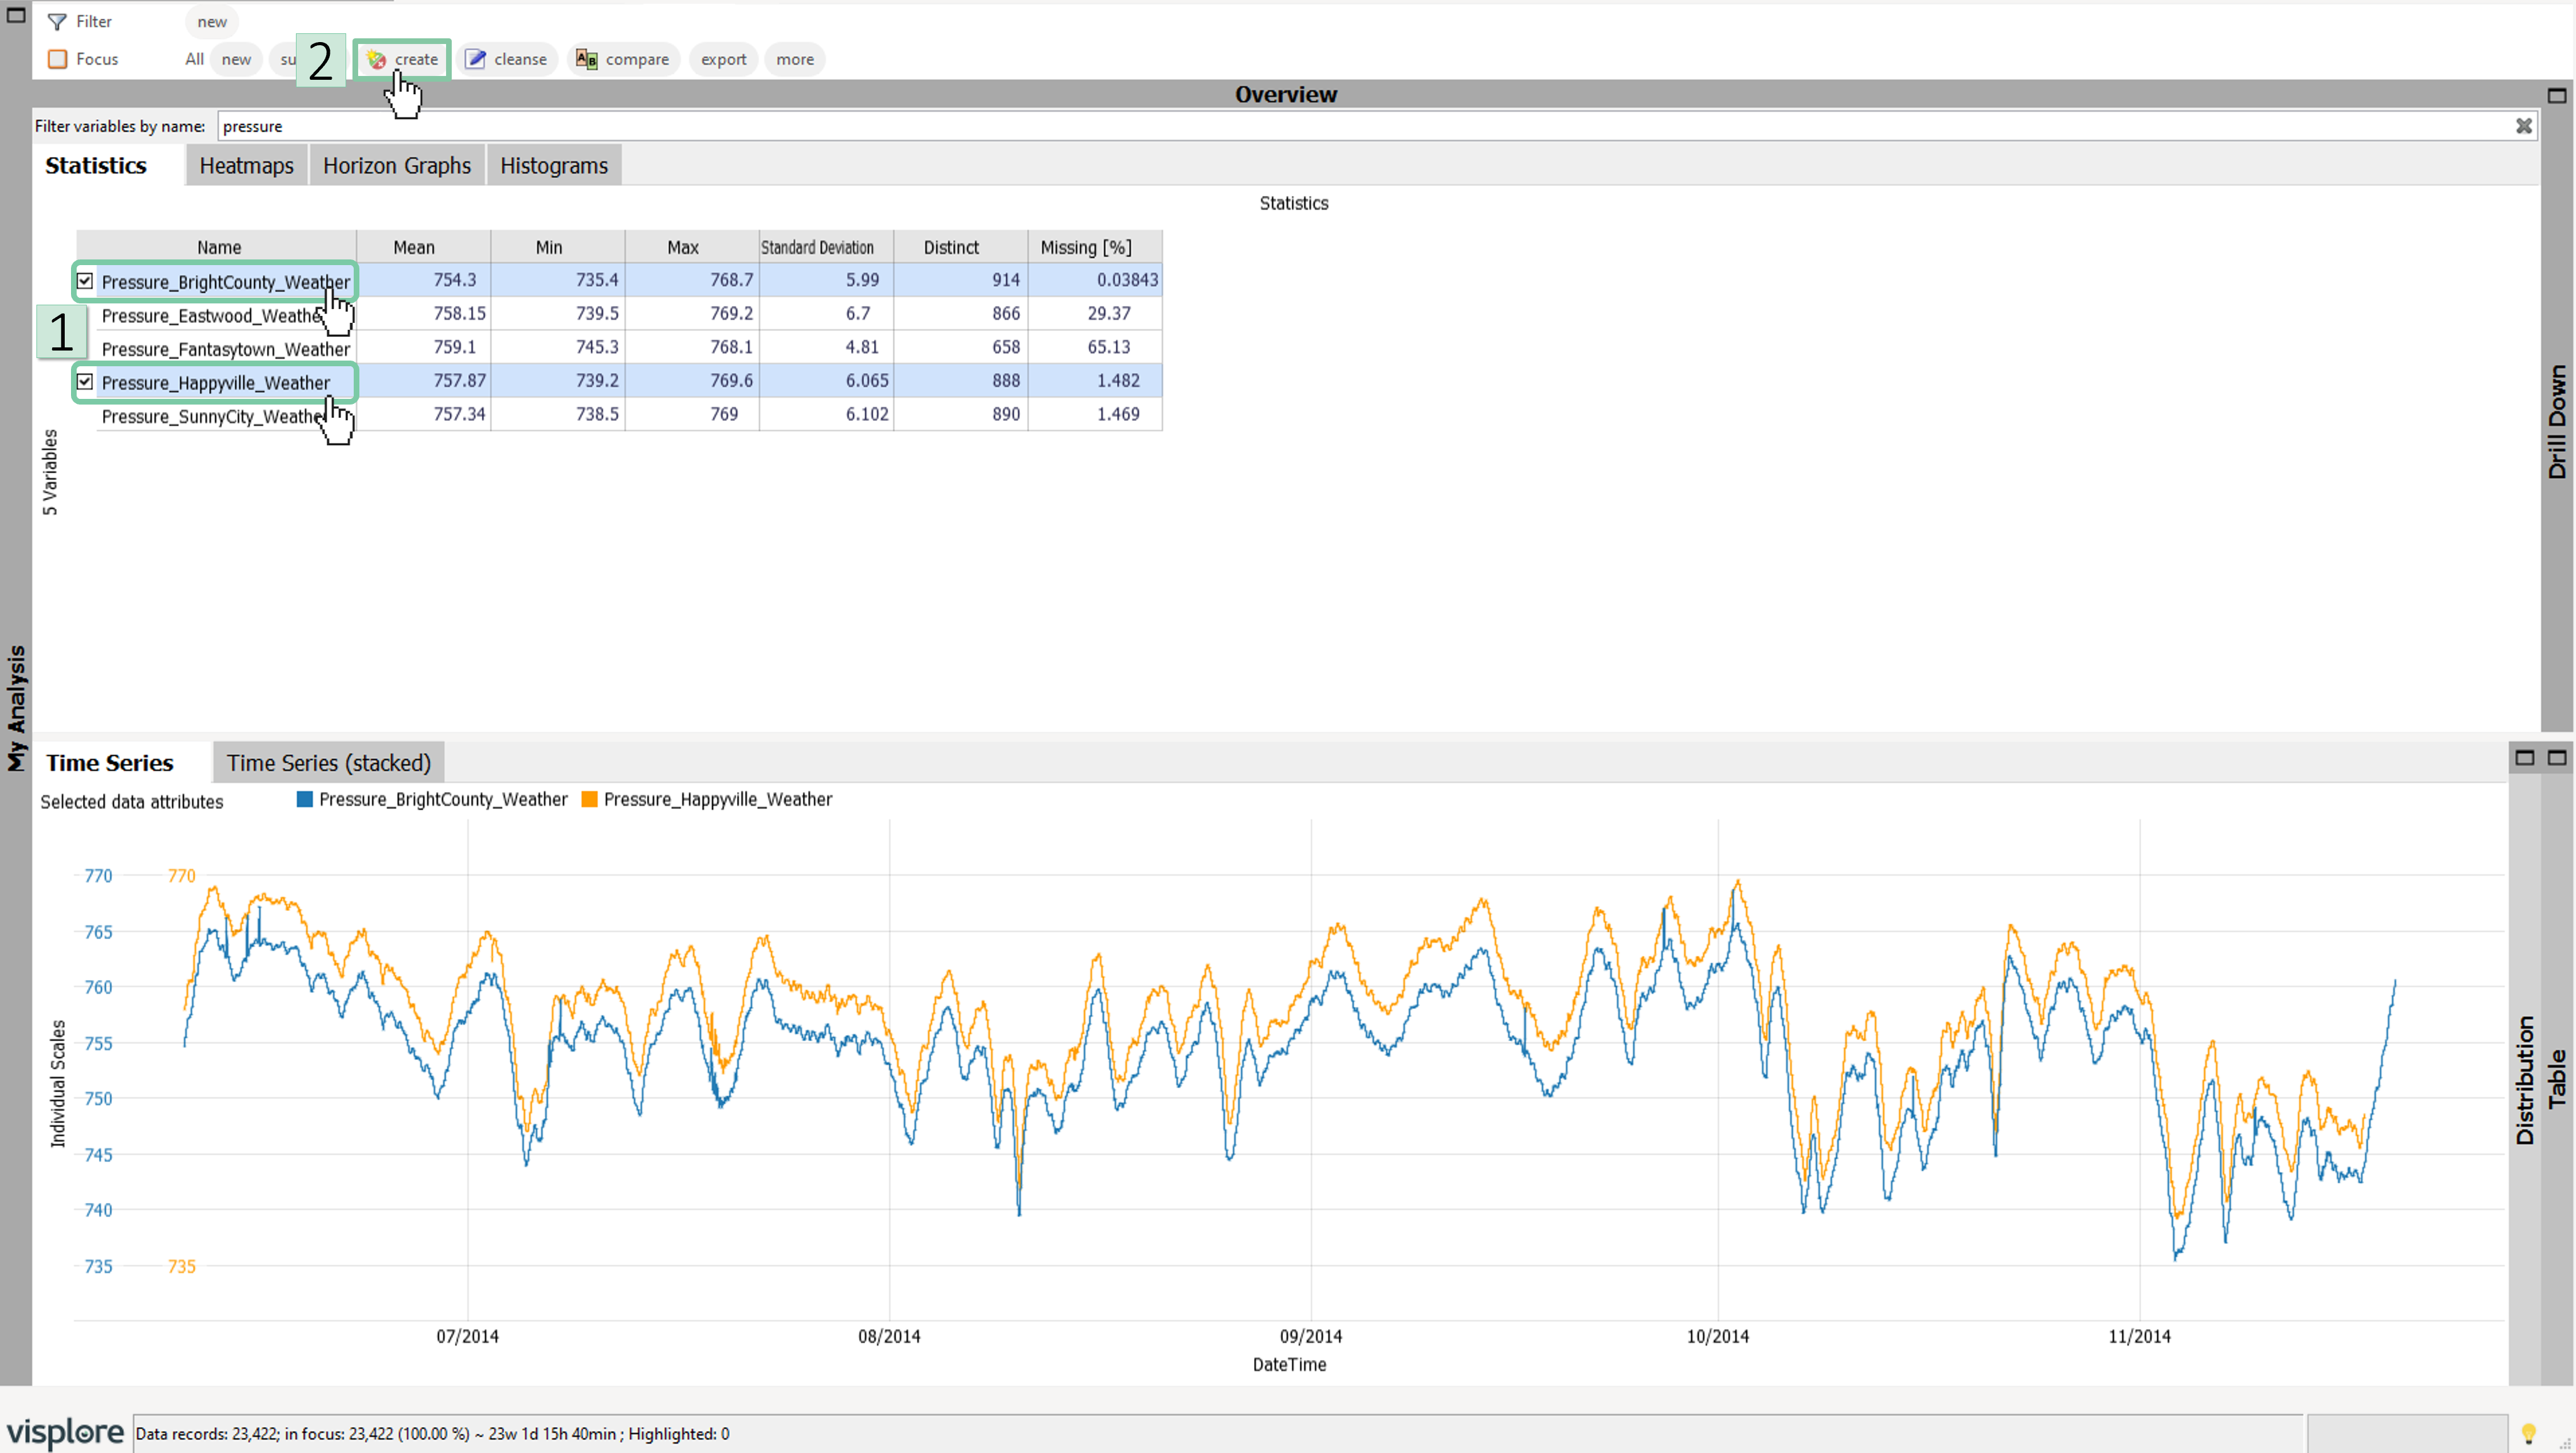
Select the time series "Pressure_BrightCounty_Weather" and add the second time series "Pressure_Happyville_Weather" by using the checkbox. Then, click "New condition" in the toolbar:
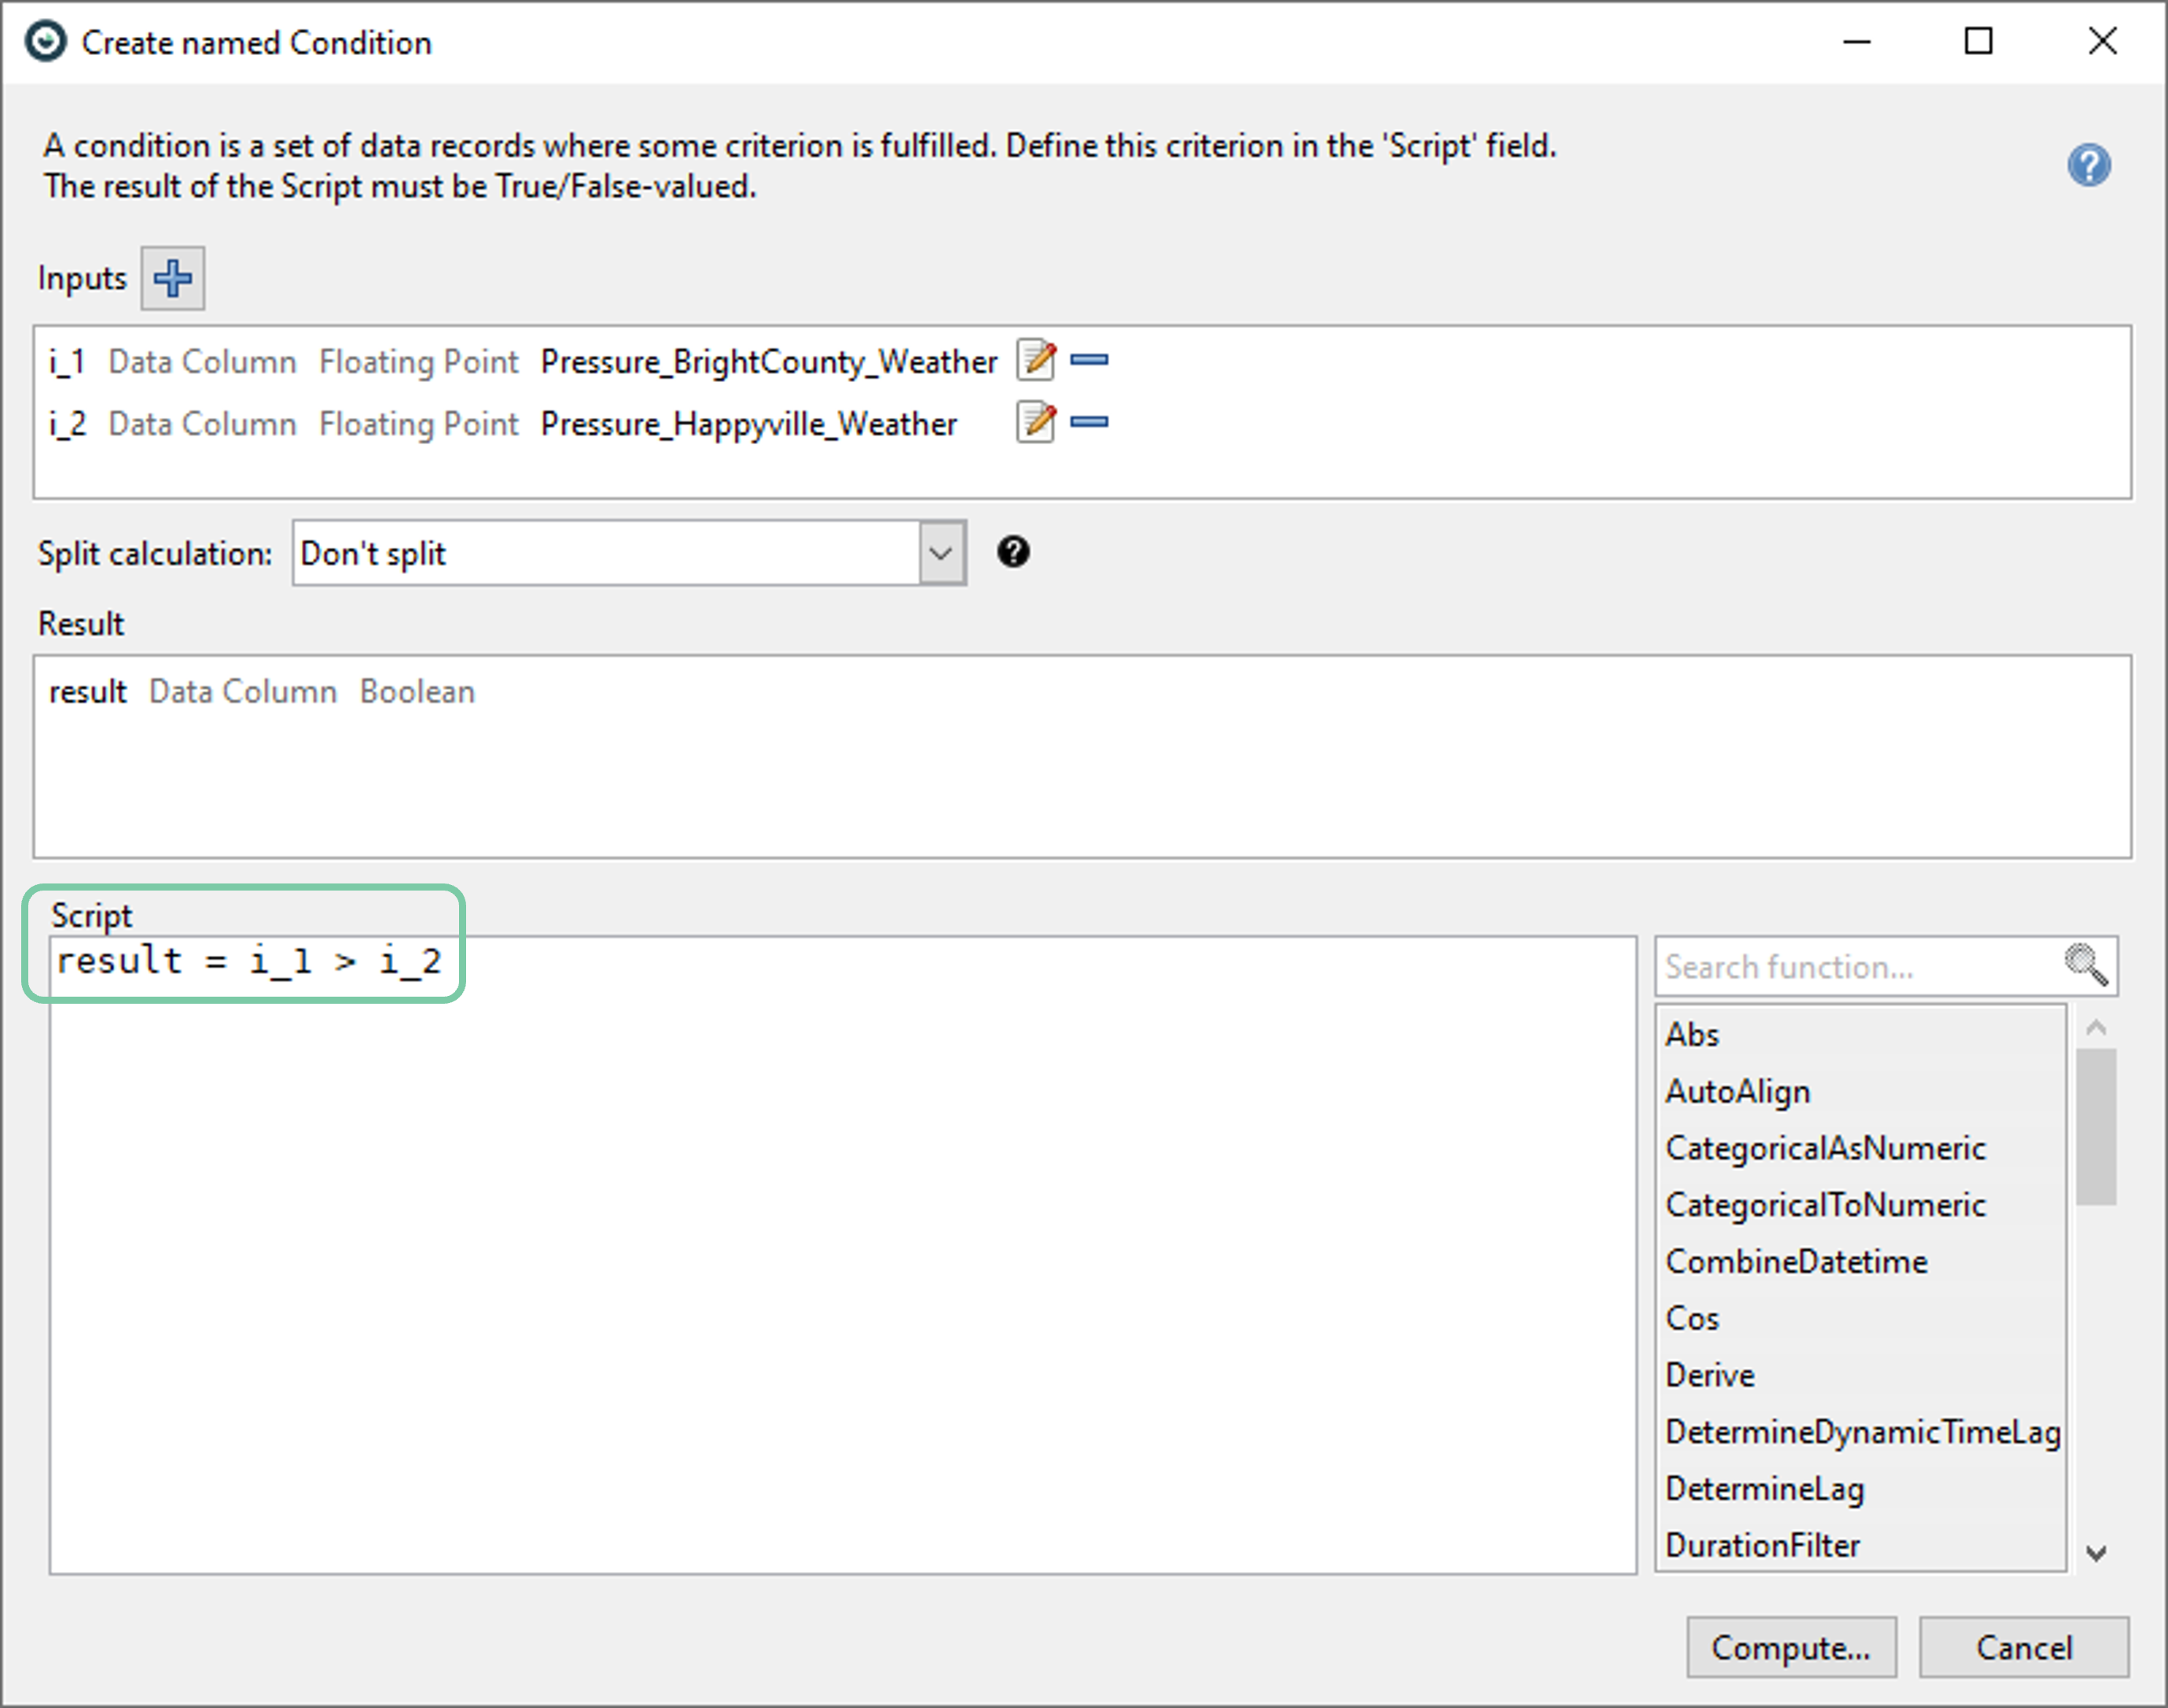
The shown dialog can be used in the same way as the dialog for creating new data attributes. The only difference is that the output here is a boolean (= logical, or binary) array, and not a numerical or categorical one.
In the "Script" field, type: result = i_1 > i_2
Confirm with "Compute"/ "OK". In the following dialog give it a shorter name, like "BrightCounty > Happyville", and confirm with "OK".
Visplore then shows the condition in the upper area as an orange shape:

Finally, we want to see how often this condition occurs:
Click the orange shape of the condition we just created, then choose "Put in focus".

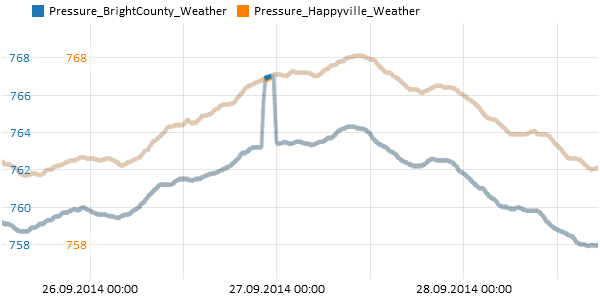
Now, the times where the condition is fulfilled are in focus. We see in the footer bar of Visplore, that this only happens at 5 timestamps, corresponding to 50 minutes of the data. The "Time series" view highlights these points.

Zoom in to these points in the "Time Series" view by dragging a rectangle around them with the right mouse button, to inspect this rare case in detail (see image above).
It appears, this is a rare condition appearing due to a data artifact rather than in a plausible way.
You can also dynamically edit the script of a condition. Click the orange shape of the condition  , and choose "Edit / rename". This allows for dynamically querying your data, and seeing in real-time how often it occurs, how it distributes, etc.
You can change the script of a computed data attribute later on. For example, if you discover you made a mistake in the formula, or you want to tweak some parameters based on what you saw in the visualization. For editing refer to the chapter Computing new data attributes.
Defining conditions with splits per category
It is also possible to define a condition per category or category combinations. In this example, the aim is to create a condition that returns true if the average monthly outdoor temperature at HappyVille is higher than SunnyCity.
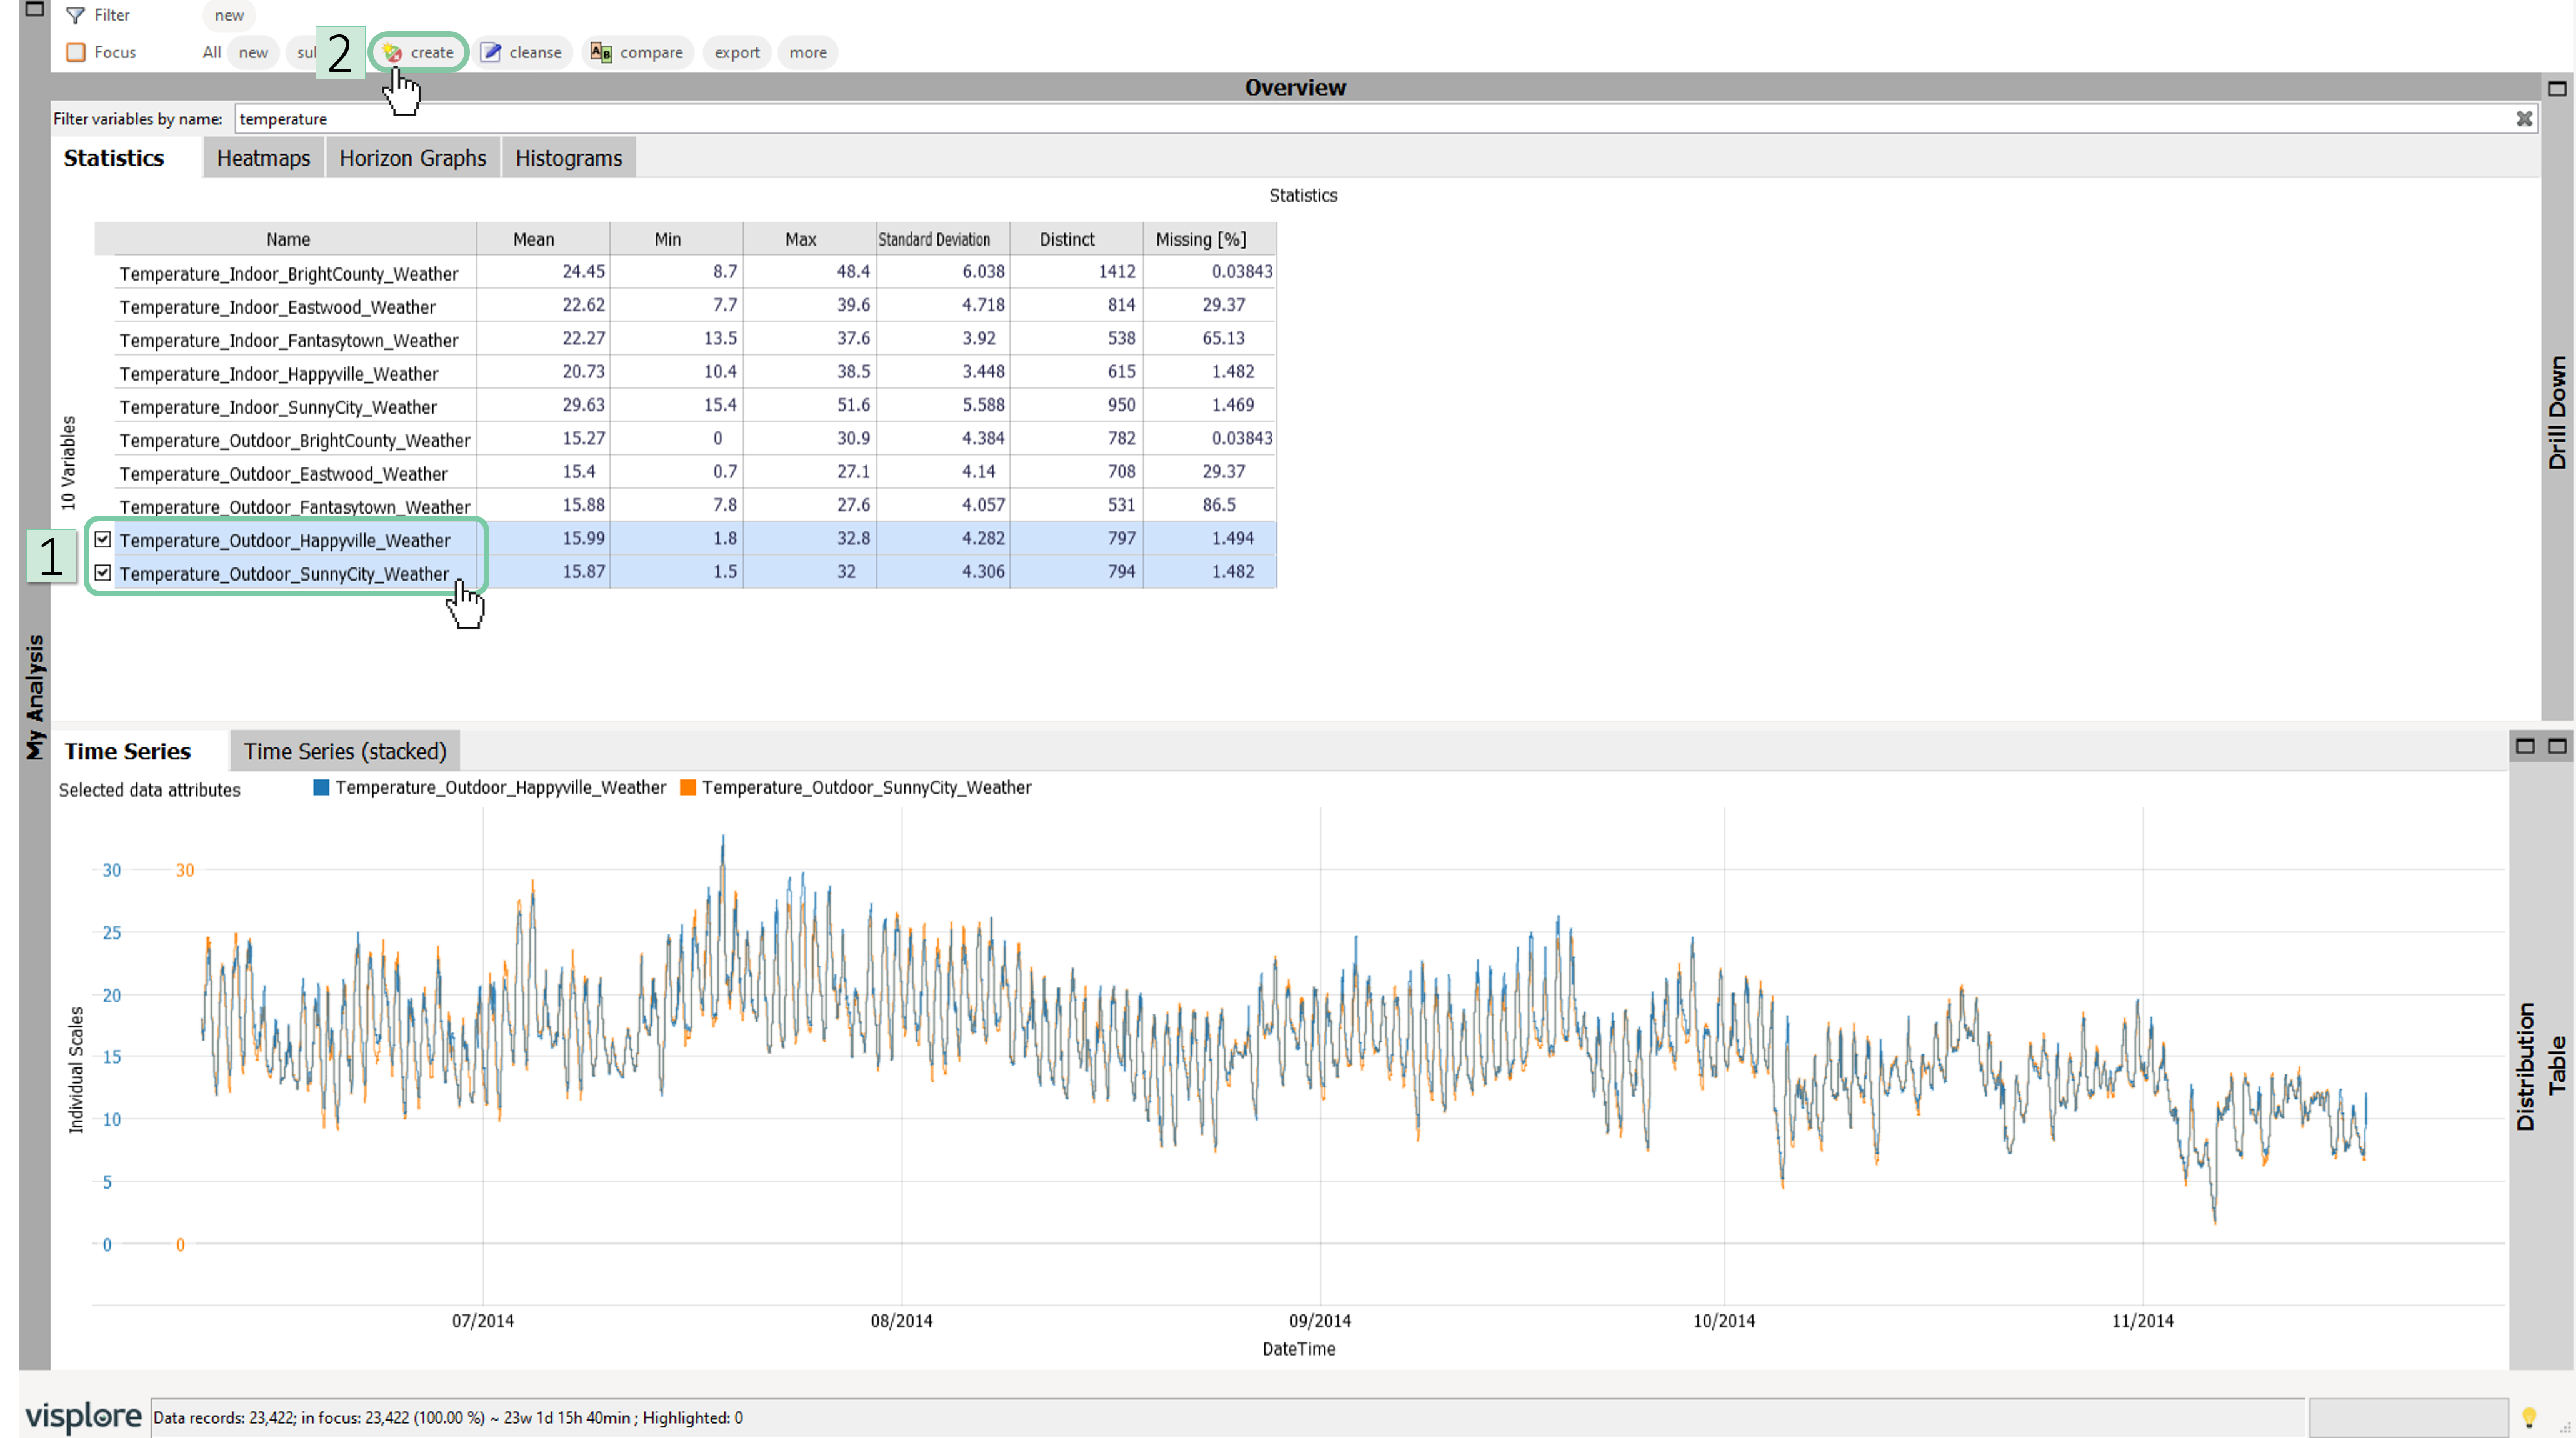
1. Select variables “Temperature_Outdoor_Happyville_Weather” and “Temperature_Outdoor_SunnyCity_Weather”
2. Click “New condition” icon in the toolbar.
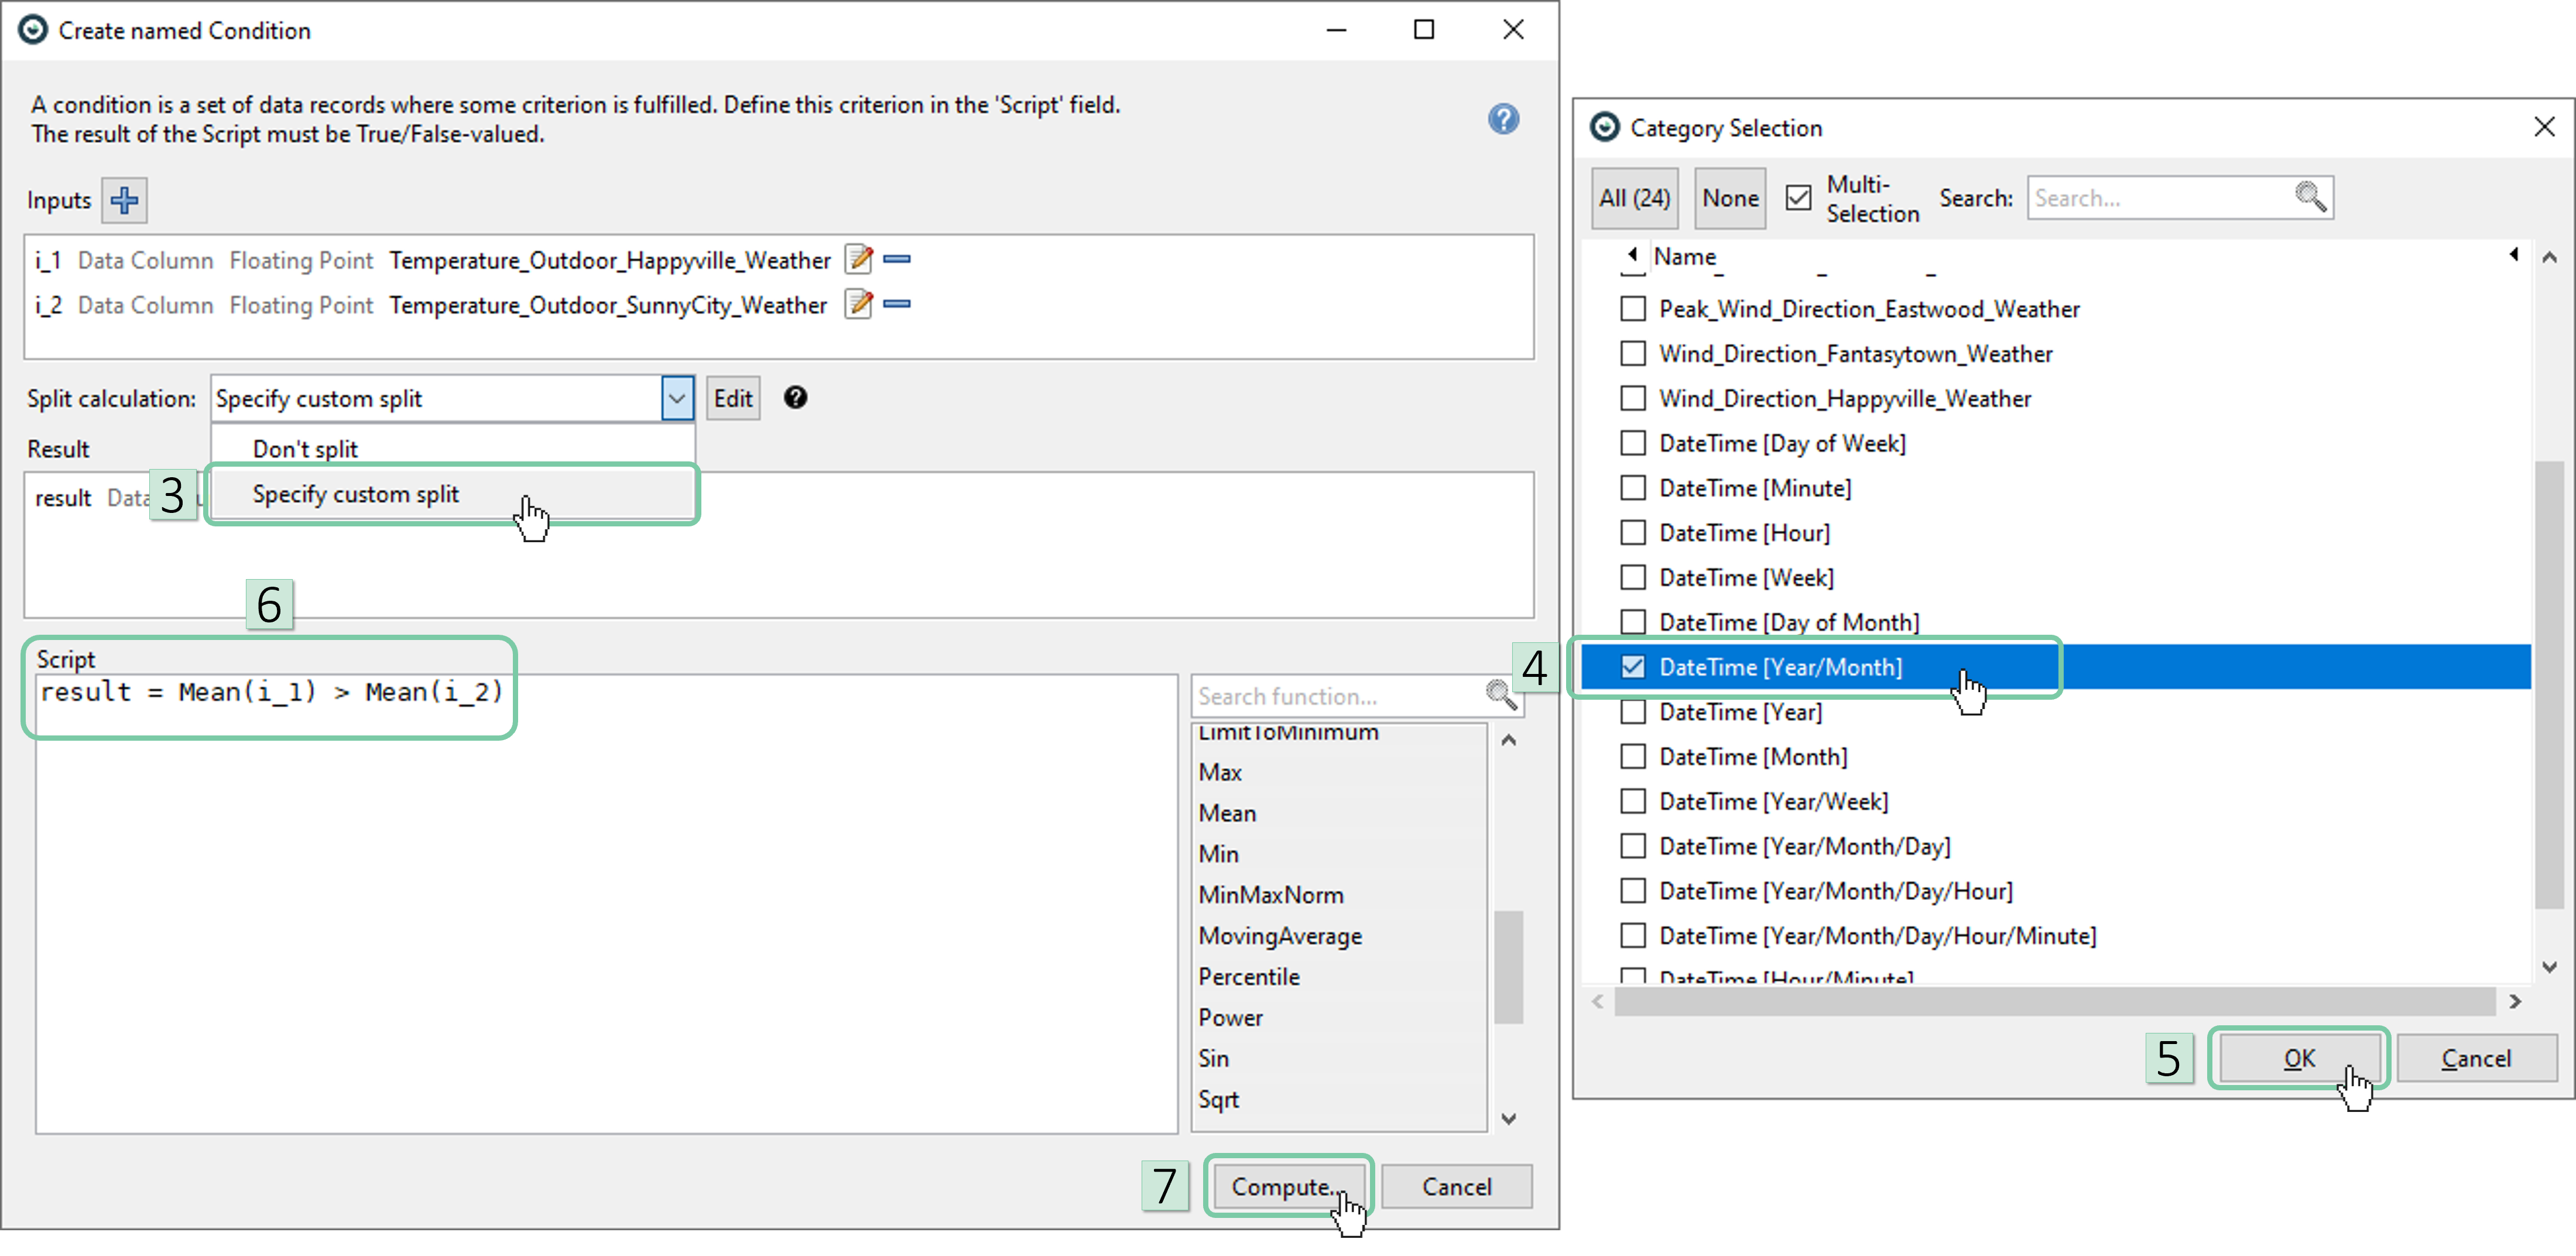
3. From the “Split calculation” drop-down menu, click “Specify custom split”.
4. Select months as the splitter category as shown.
5. Click “OK” on the “Category Selection” window.
6. Copy the following script to the editor: “result = Mean(i_1) > Mean(i_2)”
7. Click “Compute” and give an appropriate name to the condition in the following window.
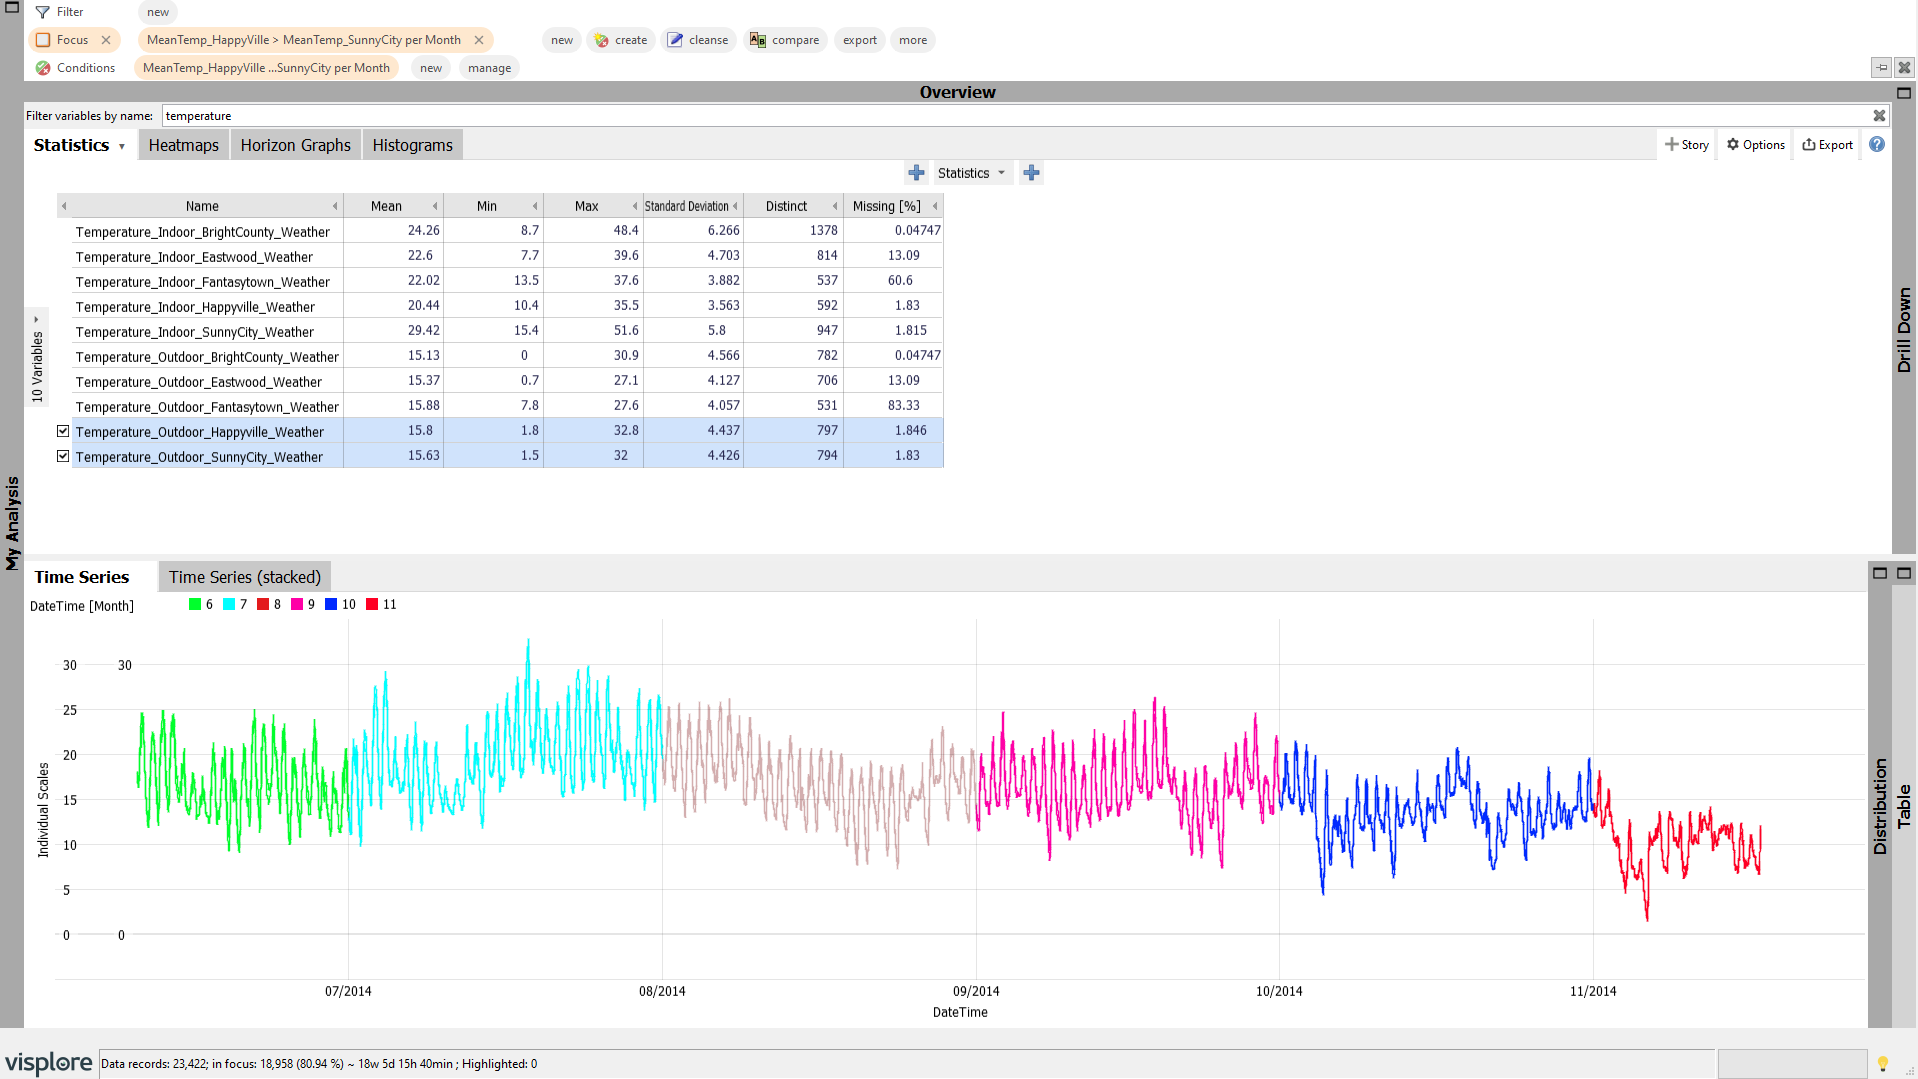
When the created condition is moved to the focus, you should notice that the condition is met for the whole duration except August. This means that the average outdoor temperature of HappyVille was lower than the average outdoor temperature of SunnyCity only for August.
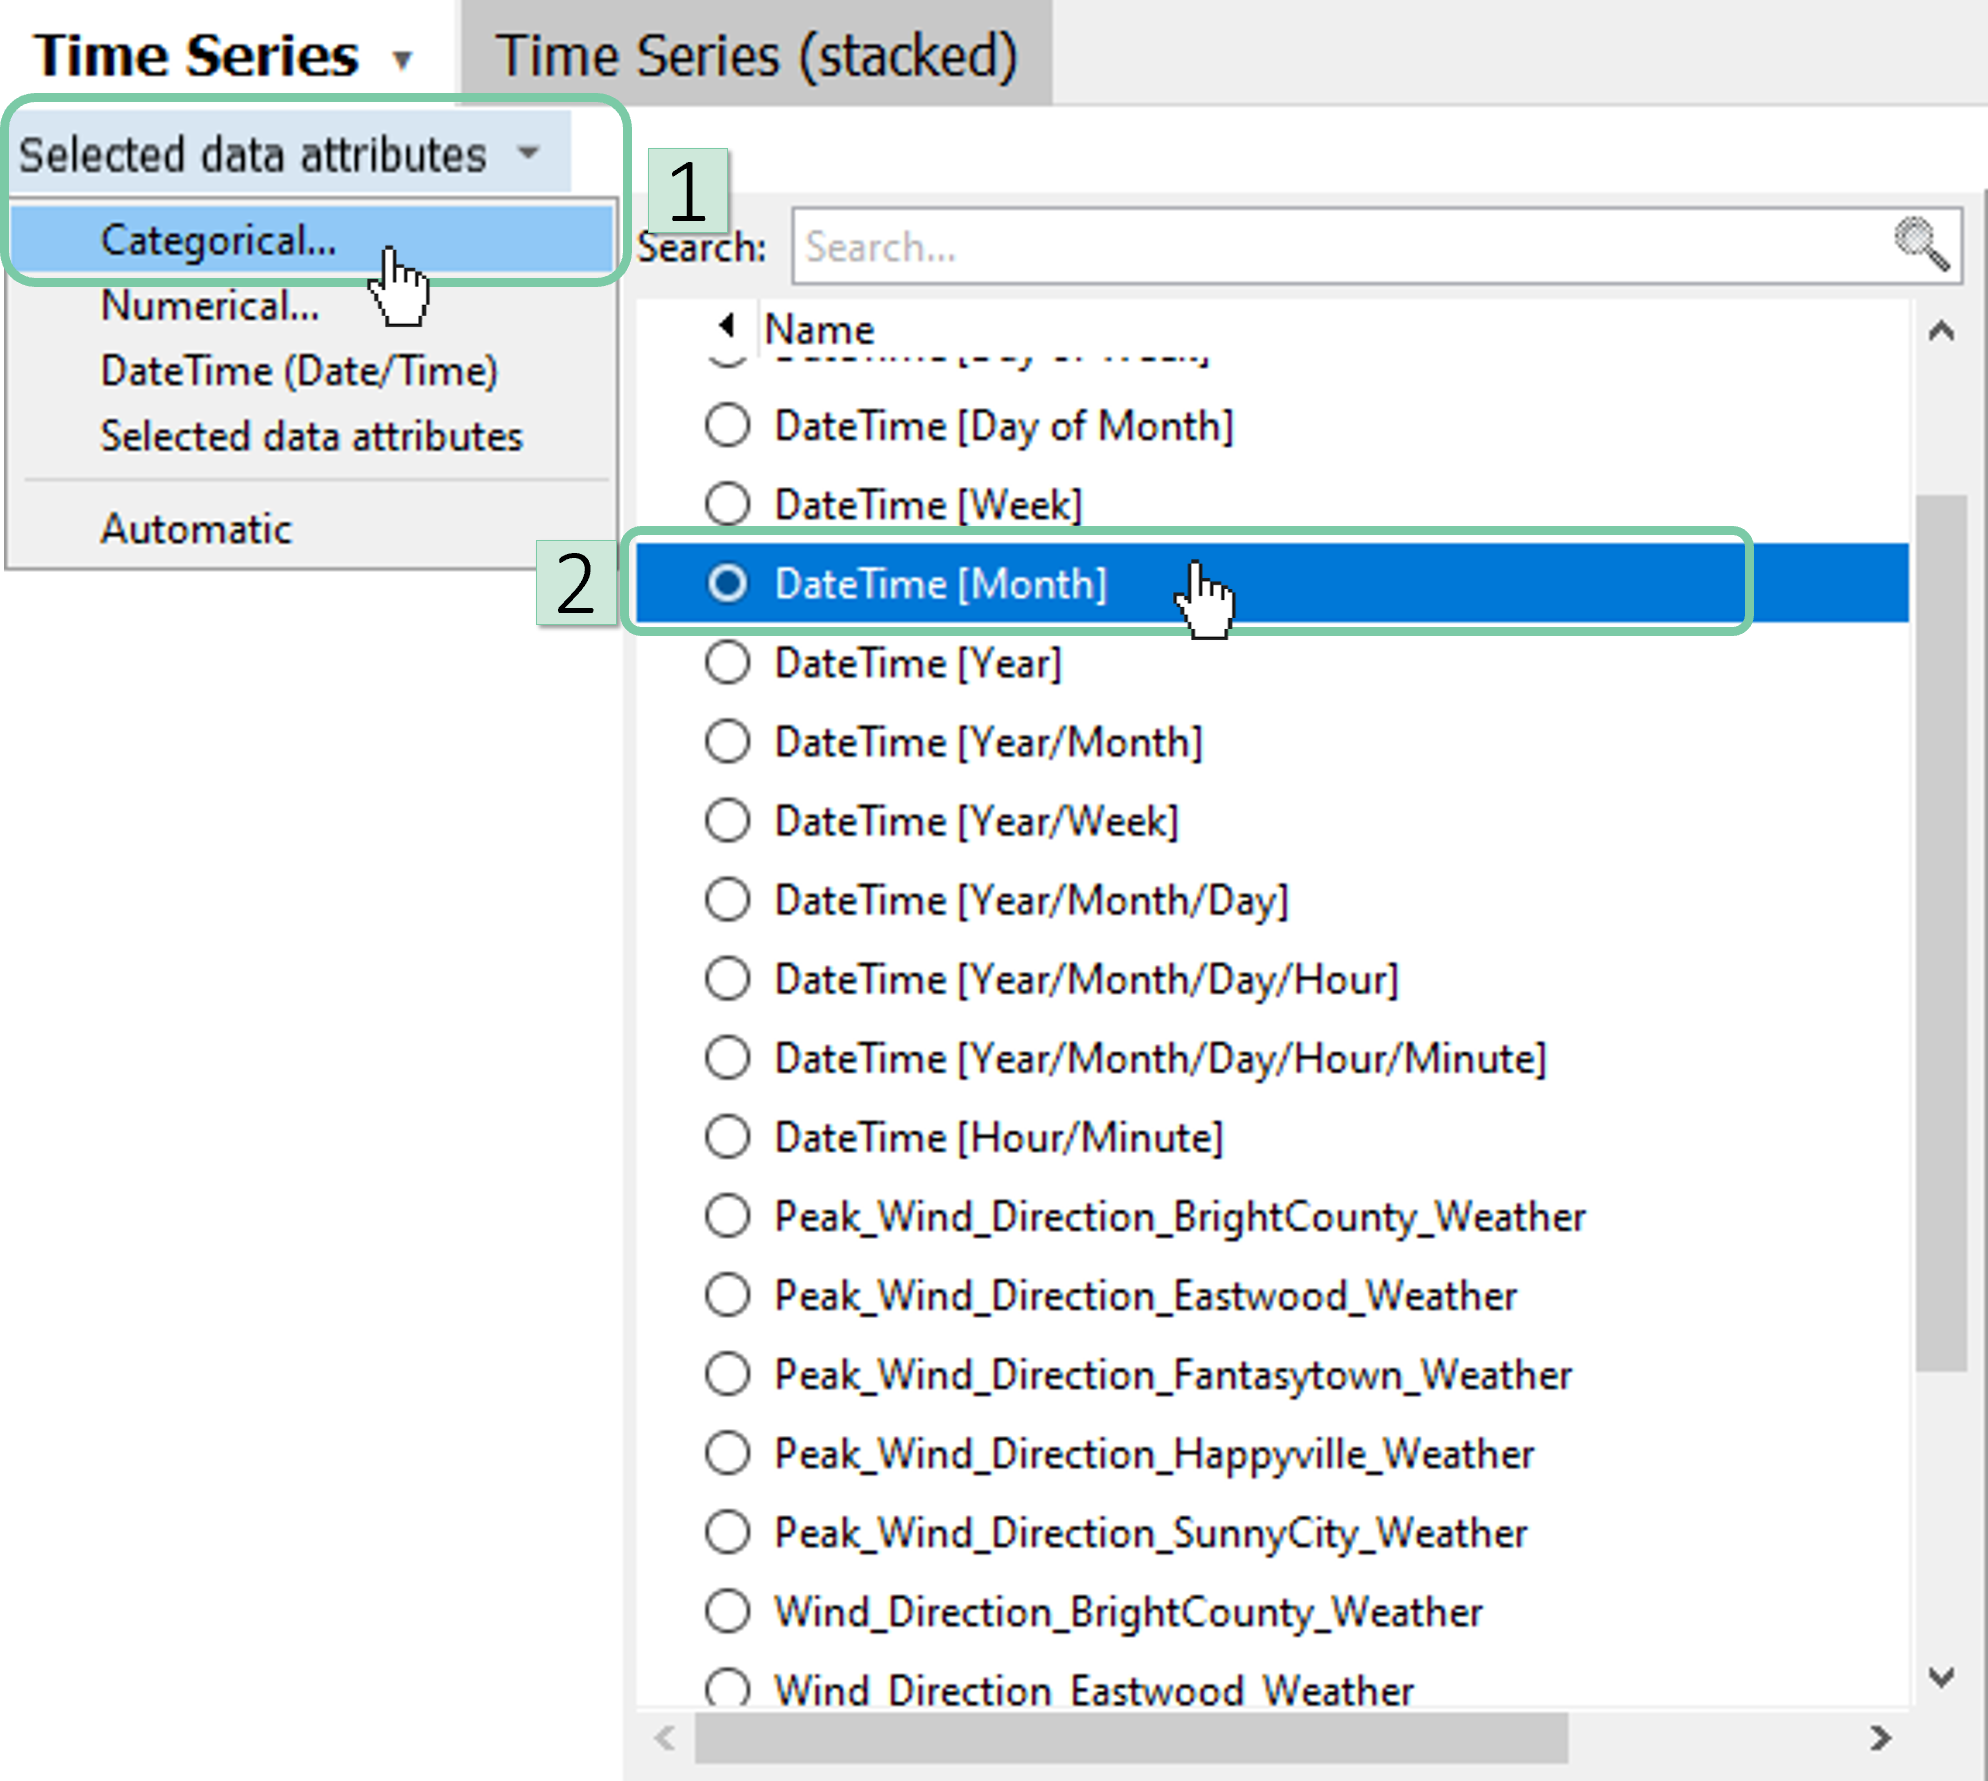
1. To better illustrate that, click “Selected data attributes” in the “Time Series” view and select “Categorical…” from the drop-down menu.
2. Click “DateTime [Month]” Notice that in the time series, the span corresponding to August is not highlighted opposed to other months.
Conditions as 1/0 variable
You can add a condition also as a variable. This allows you to plot and export conditions like any other variable. Note that these conditions are a little different as they contain values of either 1 (for true) and 0 (for false).
Click on your condition "BrightCounty > Happyville" and choose "Add as variable".

Characters such as “<” and “>” are not allowed to be part of a variable name. As such they will be removed. Please adjust your naming in this case using the edit button  . Here we renamed the condition to "BrightCounty larger than Happyville".
Add "BrightCounty larger than Happyville" using the check box to see the variable indicating either 0 or 1 in the "Time Series" plot.
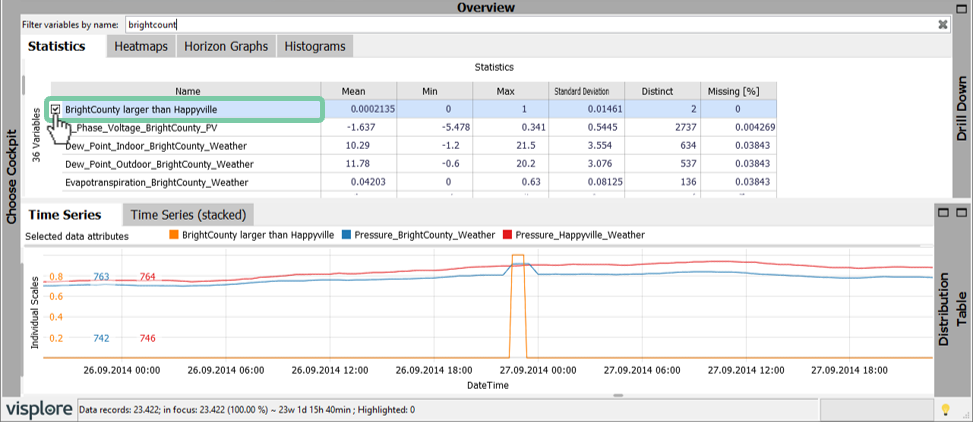
When you save your session, all the created data attributes and conditions are kept, so that you can apply the same analysis again when you get new data. By adding a condition as a variable, you can also export them as csv.
Now you know how to use conditions to filter and refine your data through the use of selections or formula. Also you can export your conditions
License Statement for the Photovoltaic and Weather dataset used for Screenshots:
"Contains public sector information licensed under the Open Government Licence v3.0."
Source of Dataset (in its original form): https://data.london.gov.uk/dataset/photovoltaic--pv--solar-panel-energy-generation-data
License: UK Open Government Licence OGL 3: http://www.nationalarchives.gov.uk/doc/open-government-licence/version/3/
Dataset was modified (e.g. columns renamed) for easier communication of Visplore USPs.
