Frequency analysis (FFT Functions)
Utilizing Fast Fourier Transform (FFT) functions for time series data analysis offers a robust framework for uncovering hidden patterns and insights within signals. It enables the identification of dominant frequencies associated with faults or anomalies, as well as the detection of periodic behavior. These functions also facilitate the application of filters to isolate specific vibration components for diagnostic purposes, empowering users to make informed decisions and gain deeper understanding.
The FFT functions in Visplore provide versatile methods for analyzing frequency characteristics in time series data. They offer features such as data manipulation before FFT analysis, including subtracting the mean or handling irregular data through resampling and interpolating. Additionally, users benefit from flexibility in frequency units, sampling rates, and the ability to conduct analyses within defined time windows, ensuring adaptability to diverse analytical needs.
Dominant Frequency
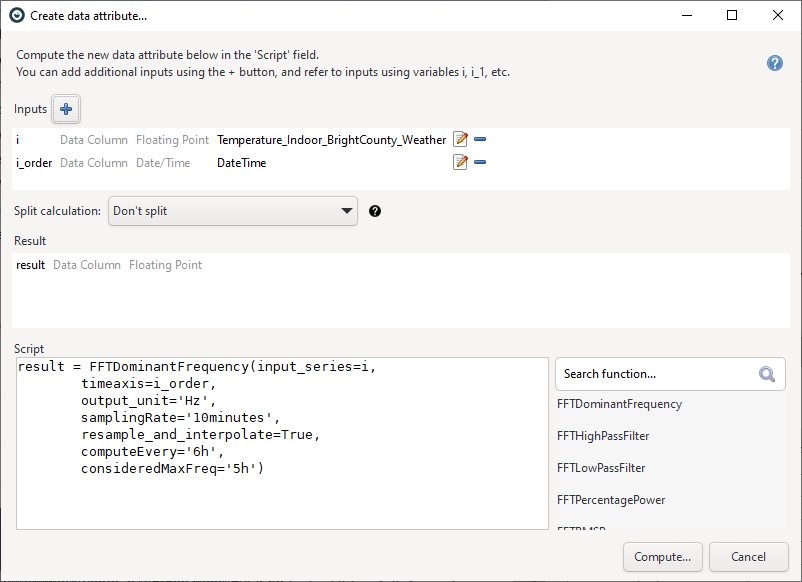
The FFTDominantFrequency function calculates the dominant frequency of the FFT spectrum for the given time series. Providing the flexibility to analyze designated frequency ranges and preprocess data through actions like subtracting the mean or addressing irregularities via resampling and interpolation, this function delivers results in either Hz or time units.
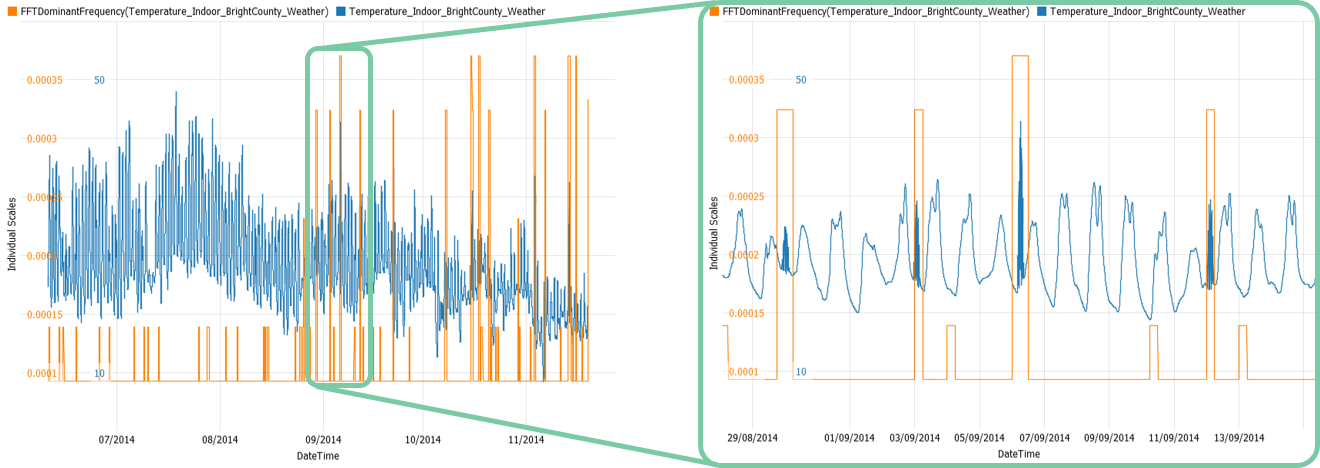
Leveraging the results of the dominant frequency analysis, users can seamlessly label, cleanse, and scrutinize data to pinpoint anomalies or periodic behavior. One notable application is the detection of oscillations in signal values, as oscillatory events typically manifest with higher frequencies than normal values. Visplore makes it easy to immediately visualize the occurrence of these events.
In the below example, temperature values were recorded with occasional errors resulting in unwanted oscillations. Addressing this issue requires the identification of these oscillations. Utilizing FFTDominantFrequency, users can assess the dominant frequency within 6-hour windows, facilitating the detection and subsequent correction of erroneous values.
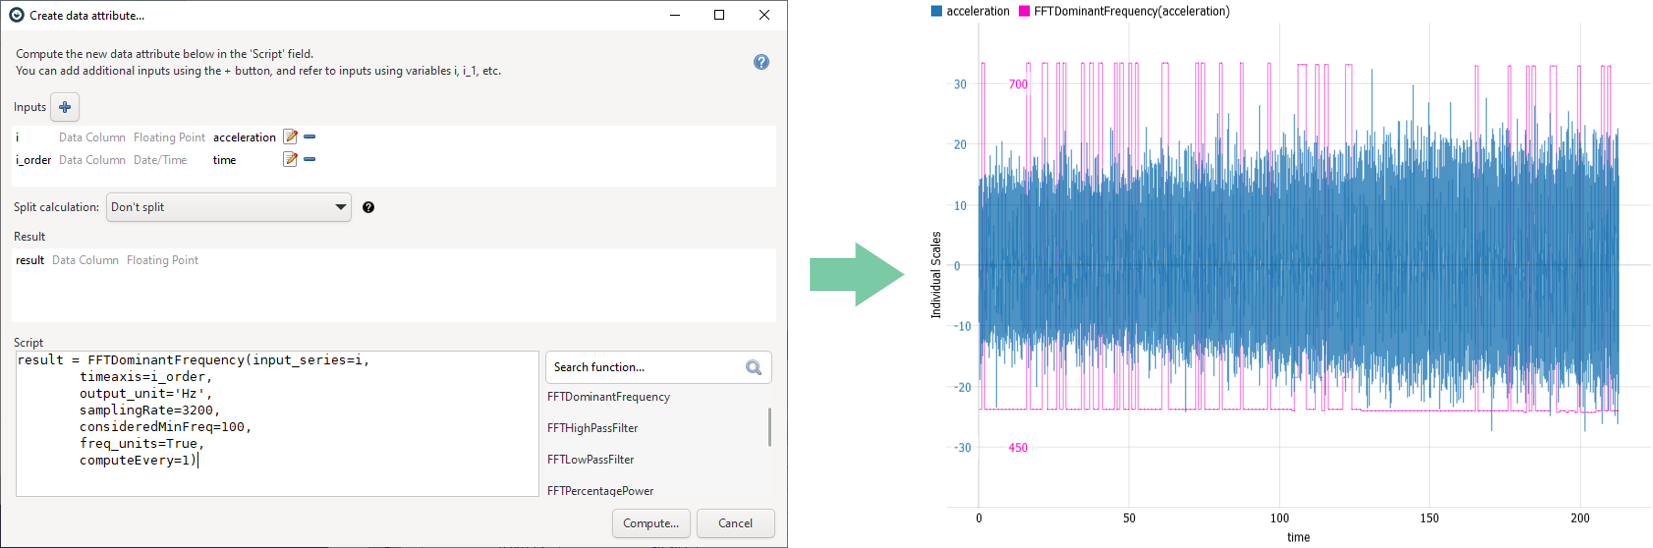
Additionally, calculating the dominant frequency is feasible even when only a numerical time axis is available. By configuring the input parameters appropriately, we can quickly compute the dominant frequency in Hz for each time window.
It's important to note:
- The samplingRate must match the data sampling frequency in Hz. For instance, if there are 3200 data records per second, the samplingRate must be set to 3200.
- The freq_units parameter needs to be True when dealing with a numerical time axis.
High-pass/low-pass filter
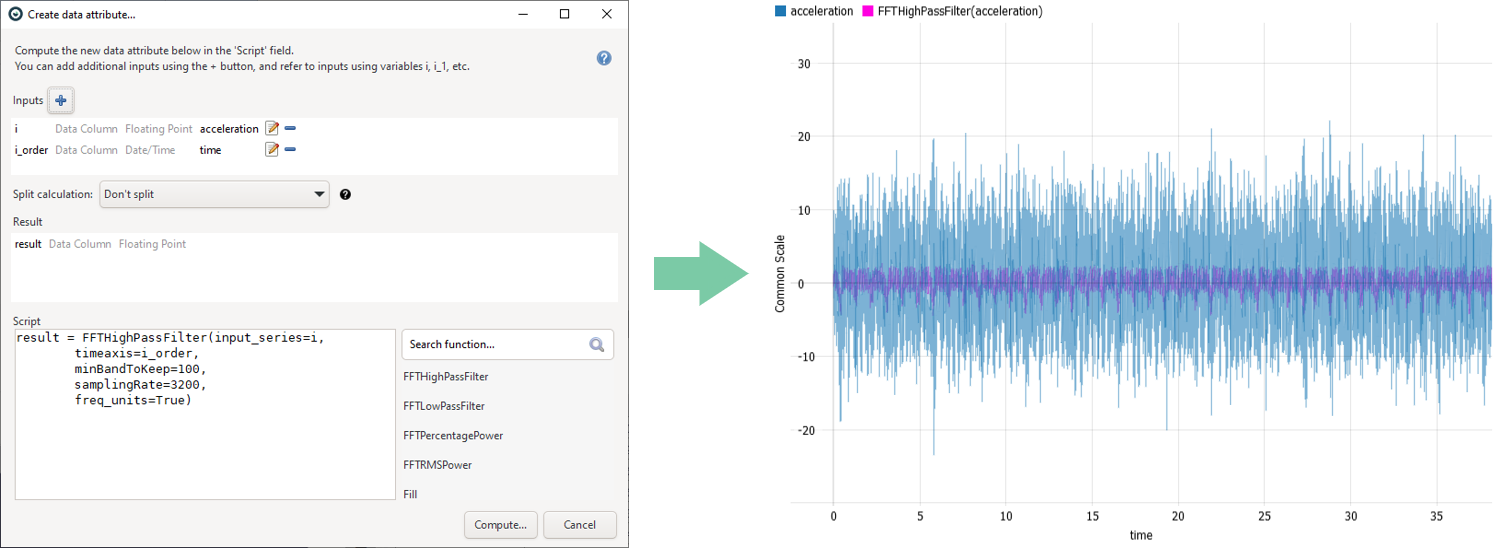
The FFTHighPassFilter and FFTLowPassFilter functions effectively apply a high-pass/low-pass filter to the given time series that preserves frequencies above a specified minimum/maximum threshold. These functions are equipped to handle irregular data by applying resampling and interpolation techniques.
By leveraging these functions, users can easily create a new signal attribute with filtered noise, improving the data's clarity and reliability for further analysis or visualization.
Frequency response functions
The FFTPercentagePower function calculates the percentage of power in a specific frequency band compared to the entire spectrum or another specific band. This functionality provides valuable insights into the significance of particular frequency ranges within the broader signal context. Understanding the distribution of power across different frequency bands aids in identifying key components and assessing their impact on the overall signal dynamics.
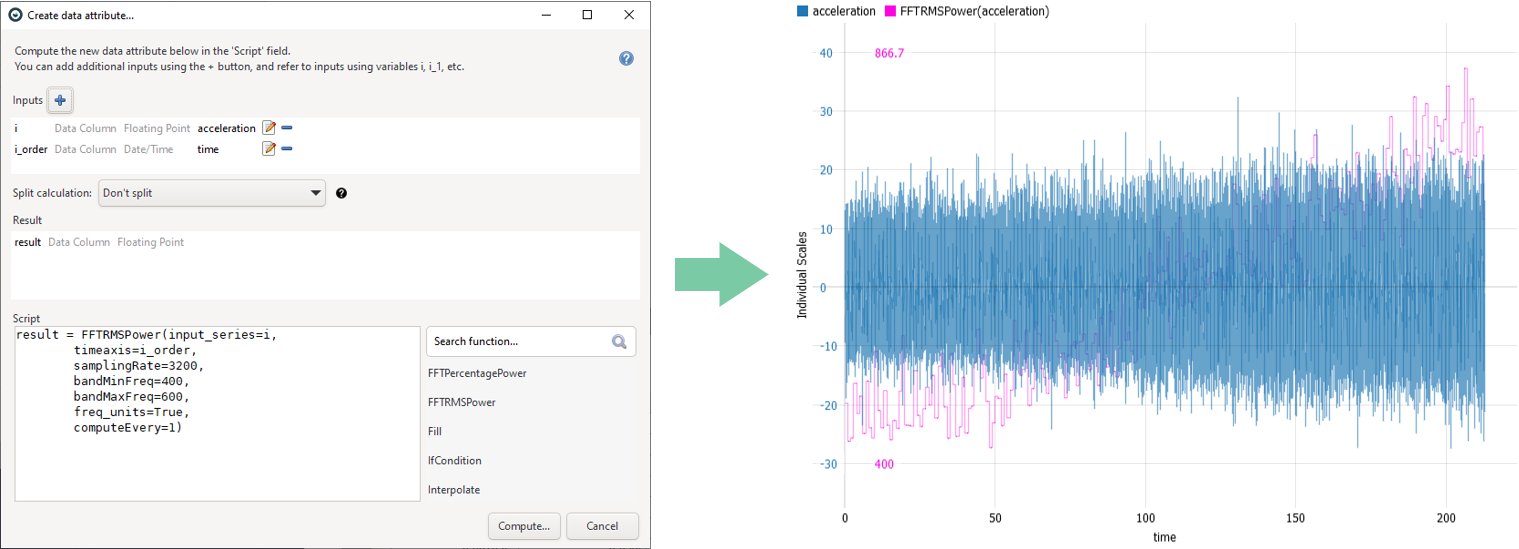
The FFTRMSPower function calculates the power within a specific frequency band using the root mean square (RMS) method. By analyzing RMS power, the total energy contribution can be effectively quantified and its significance within the broader frequency spectrum evaluated.
License Statement for the Photovoltaic and Weather dataset used for Screenshots:
"Contains public sector information licensed under the Open Government Licence v3.0."
Source of Dataset (in its original form): https://data.london.gov.uk/dataset/photovoltaic--pv--solar-panel-energy-generation-data
License: UK Open Government Licence OGL 3: http://www.nationalarchives.gov.uk/doc/open-government-licence/version/3/
Dataset was modified (e.g. columns renamed) for easier communication of Visplore USPs.
License Statement for the Gearbox Fault Diagnosis Dataset used for screenshots.
Source of Dataset: National Renewable Energy Laboratory. (2018). Gearbox Fault Diagnosis Data [data set]. Retrieved from https://data.openei.org/submissions/623.
License: CC BY 4.0 DEED: https://creativecommons.org/licenses/by/4.0/