Visplore version v2023a
We are pleased to introduce many long-awaited possibilities to you! Generating value from your PI system and other data sources has never been easier. Find out, what the new version has to offer.
If you want to experience the new version in action, you can watch the recording of our recent webinar, or contact us for a personal live demo!
Combine data from PI and other sources on the fly
Does your analysis involve data which is not (yet) in your PI system?
Harmonizing data from different sources can be labor-intensive. With the new Visplore version, time-dependent data from any number of sources can be merged quickly and easily – within minutes, without lengthy IT projects, or programming knowledge. A time reference is all that’s needed to jointly analyze process data from PI, files, SQL data bases, and other historians on the fly. Visplore harmonizes continuous time series and discrete events in any desired temporal resolution. The prepared data can be exported, so that the preparation alone saves many workhours. Visplore can automatically reiterate all processing steps on the most recent data – making data preparation easy and automatized. Let’s look at three use case scenarios:
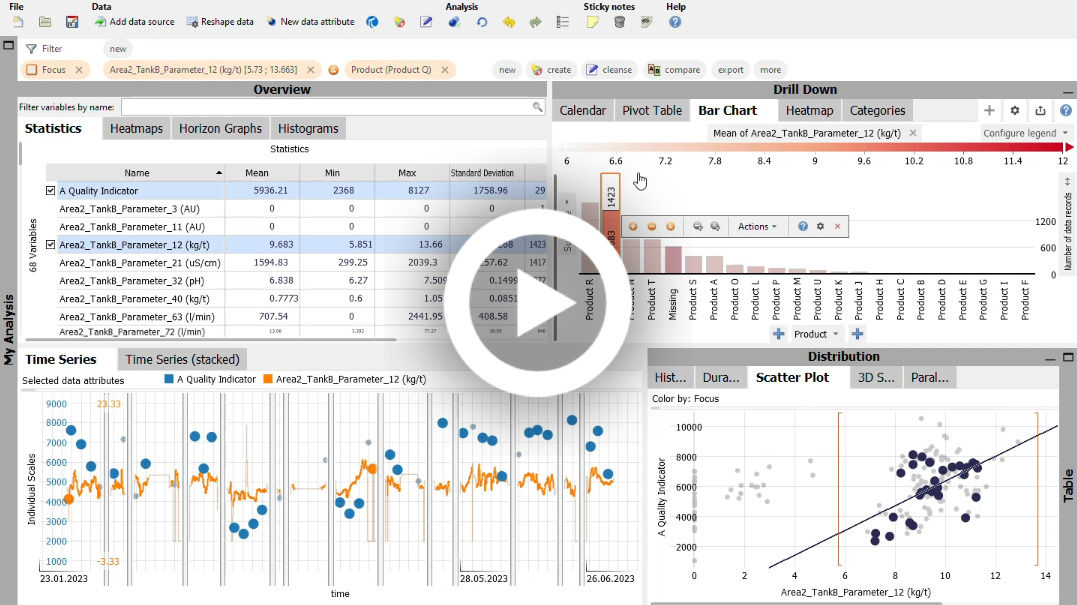
- Scenario 1: Correlate process data from PI, quality measurements from a data base, and contextual data from the ERP system
See how process parameters impact KPIs such as quality indicators while discriminating different products, suppliers, batch phases, and much more!
See how to integrate process data from PI with quality samples and contextual data from an ERP system.
- Scenario 2: Compare multiple distinct time periods from PI
Do you need to compare recent data with specific historical reference periods? No problem! You can now import multiple different time periods from PI and compare them in as much detail as you need. - Scenario 3: Contextualize events
Enrich events such as alerts with process data to understand what happened before. Or extend logs about process interventions with data to understand the impact by comparing the time before and after.
Advanced analytics across multiple assets
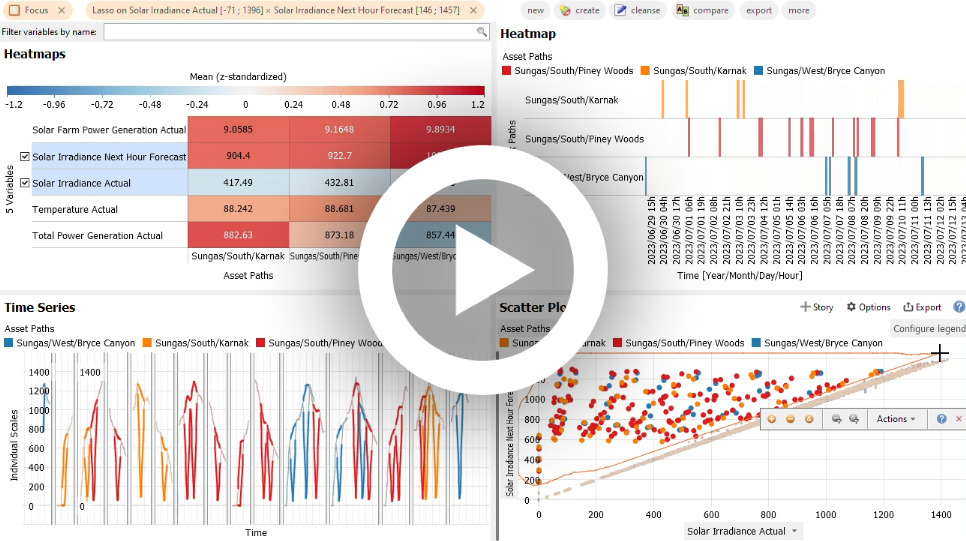
The new version of Visplore introduces unique support for comparative analytics across multiple assets from the PI Asset Framework. Do you need to identify critical conditions for many pumps, heat exchangers, power plants, pipes, or tanks? Or do you need to compare the usage and performance of machines, hydraulic presses, vehicles … ? Overseeing many assets simultaneously adds another powerful dimension to your analytics! Specifically, you can:
- set up an analysis on one asset and easily switch to another similar asset any time
- directly compare assets regarding KPIs, trends, statistics, variable distributions, correlations, …
- identify and summarize anomalies and out-of-spec operation across all your assets
- search for pattern profiles across your assets and compare profiles across assets for identifying “golden” profiles of batches or process changeovers
See asset analytics across multiple power plants.
All computations in Visplore can now be performed per asset. For example, when computing the moving average of a variable in the formula editor, Visplore computes it per asset without making the formula itself any more complex.
Reshape, rasterize, and time-shift data
For data sources outside PI, getting the desired answers can be challenging. Are different variables aligned correctly for correlations to be computed? Are the data in an appropriate degree of detail? Are there lags between sensors due to inherent process delays? The new Visplore version brings many functionalities for getting time-dependent data into the right shape. For example:
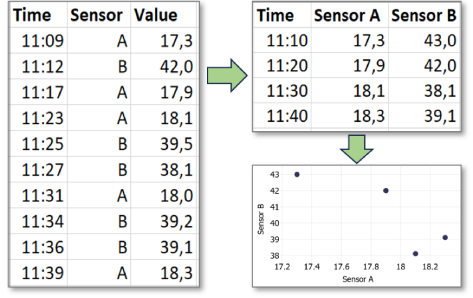
- Reshape sensor data from files or SQL data bases so that sensors can easily be correlated statistically.
- Use various interpolation and aggregation methods to bring your data into a regular time raster at the temporal resolution of your choice. Including data that is provided as events or any kind of time periods.
- Compensate for time lags between variables.
No matter if you need ad-hoc preparation of your data right now, or want to set up a powerful data processing pipeline for automatic analyses of your latest data: The new Visplore version brings data preparation of time-dependent data to a new level and ease of use.
Reshaping two sensors with temporally unaligned samples to a format with a 10 minutes raster, that can be used for correlating the sensors, for example as scatter plot.
Extended data connectivity: InfluxDB, Parquet files, TimescaleDB, Databricks, …
The new version significantly extends data connectivity to many popular data sources. Directly fetch your time series data from InfluxDB or Timescale, instantly connect to data platforms such as Databricks or Denodo, and import one or more Apache Parquet files. Of course, all these new sources can seamlessly be integrated with one or more instances of other data sources such as CSV files, various SQL databases (SQL Server, Oracle, PostgreSQL, SAP Hana, mySQL, …), and the AVEVA PI System.
When connecting to a SQL data base, a new user interface allows you to specify filters and easily get immediate data previews.
Time context visualization of events
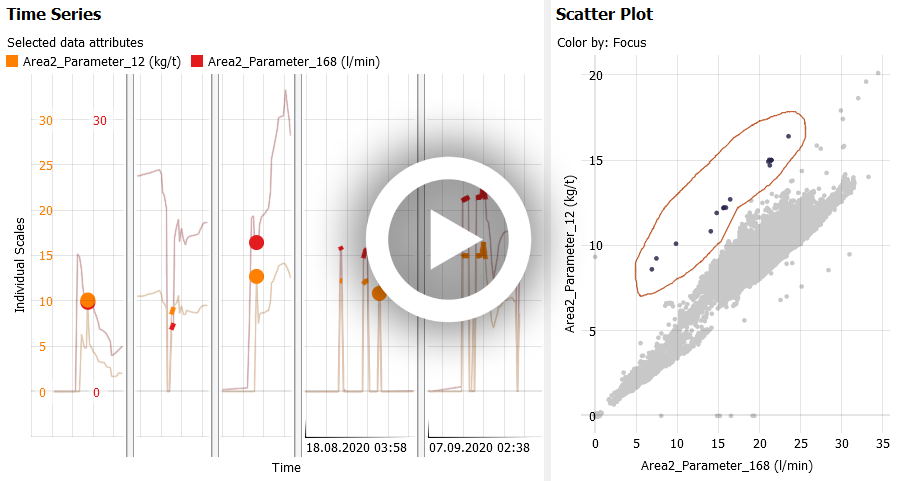
Assume you need to analyze short-term events such as gaps in the data, anomalous spikes, or process changes. It will typically be helpful to see a bit of process behavior as time context to learn what happened shortly before and after each event. The time series visualization now provides you with exactly that. Without any further configuration, selecting events in other views such as histograms or scatter plots will automatically display these events and context information in the time series visualization.
Displaying selected events with time context.
Computation and compensation of dynamic time lags
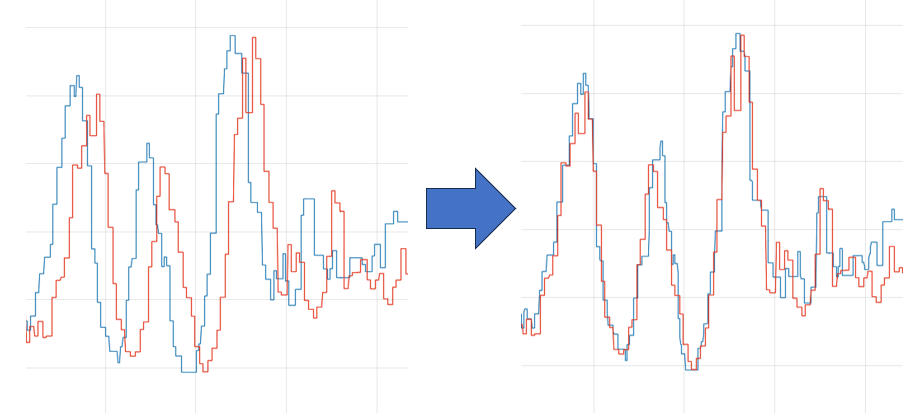
In many verticals, particularly in continuous production processes, compensating for time shifts of sensors along the production process is crucial for tasks such as root-cause analysis, predictive modeling, and optimizing the overall schedule. Solely based on sensor data and without requiring an explicit model of the process, Visplore can now estimate the dynamically changing process delays and uses this information to align the data collected along the production process.
Shifting the blue time series by a non-constant factor to align it with the red time series.
New KPIs for Pivot Tables, bar charts, heat maps, …
Several new KPIs make analysis easier and reports more expressive, e.g., the number of events (= uninterrupted time periods fulfilling a condition), the most recent value, the most frequent value, and others.
Contextualize stories with image slides
Introduced in 2022, the story feature of Visplore has quickly gained widespread popularity for structuring standardized analysis workflows and presenting insights interactively. The new Visplore version allows you to add graphics from image files as story pages. This way, you can easily add context to your Visplore story, such as title slides, or pages showing a picture of the analyzed asset.
Updated support of AVEVA PI features
- The tag search does not require a search crawler (from PI Web API 2021 SP 3)
- Increased flexibility for kerberos authentication
- Possibility to query future time periods (e.g., next 24 hours from now) for live forecasting use cases
New integrated plugin mechanism for custom Python-based data connectivity
If use cases require data connectivity beyond the integrated possibilities, a new plugin mechanism allows for writing custom data connectors in Python. An essential benefit of the new plugin mechanism is the full integration – to end users, there is no difference between such custom sources and data sources provided by Visplore, including functionalities like integration with other sources, reshaping, and automatically pulling the latest data for automatic data reports. Another benefit is a well-designed framework that makes it easy and fast to focus on the actual connection while using Visplore for many other aspects such as the GUI.
In a nutshell: lots of added value for you to get the most out of your data from PI and beyond!
The best way to experience all this is to register for our PI-specific webinar on Sept. 12th at 3pm or to contact us for a personal live demo!
Either way, we are looking forward to talking to you soon!
