Modelling Time Series for Condition-Based Monitoring

Errors can often be seen before they occur. The challenge is to recognize these signs in time while keeping the effort low.

Read here how Verbund, Austria’s largest electricity producer, used Visplore to develop an early fault detection rule for a hydropower turbine.
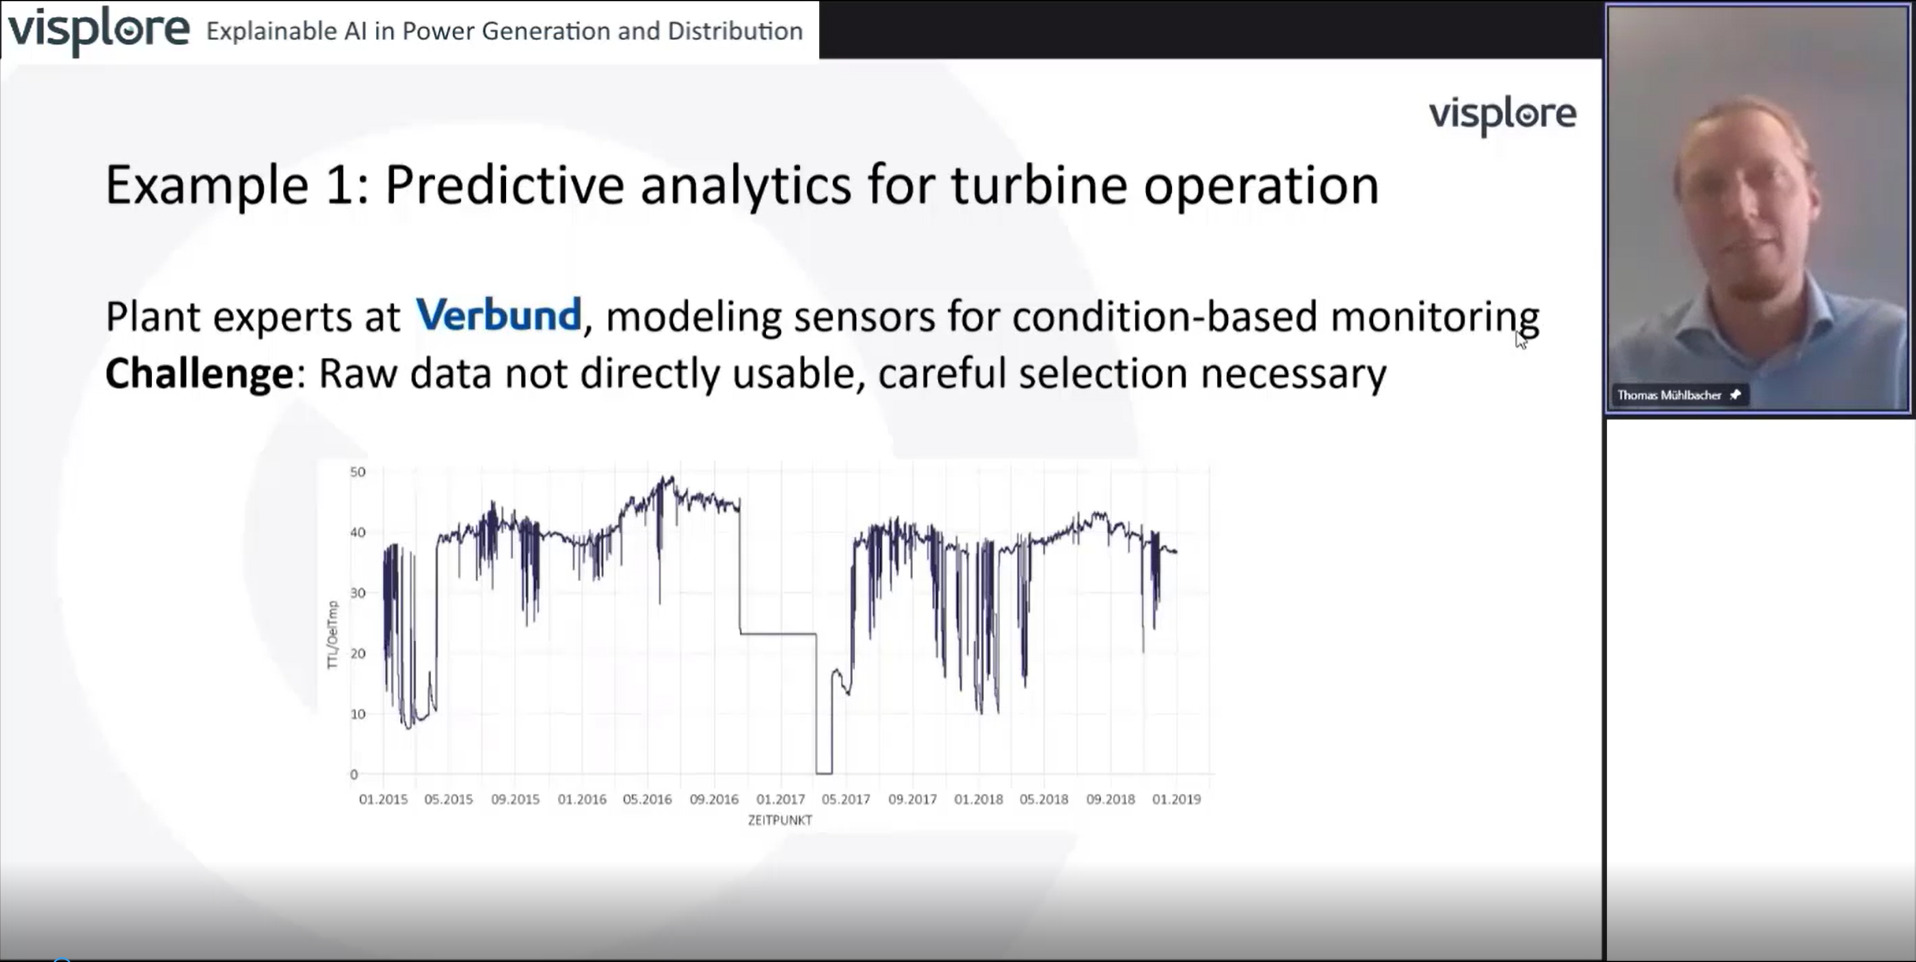
Watch this short demo and learn how easy it is to build a multivariate regression model for predicting a turbine’s normal expected oil temperature from raw sensor data within minutes.
Condition-based monitoring
Intuitive modelling for early fault detection

Implement condition-based monitoring of your assets as fast and easy as never before! Visplore Professional covers all steps with intuitive graphical tools – data preparation, sensor modelling, monitoring using dynamic tolerance bands, and root-cause analysis. This enables to detect and understand problems of your assets earlier – for reliable operation.

  • Save significant time in validating & preparing data
  • Model sensor behavior by multivariate regression without programming skills
  • Define dynamic tolerance bands based on the modelled behavior
  • Compare models for informed selection
  • Investigate tolerance violations in detail to identify root causes
  • Detect tolerance violations, anomalies and drifts across hundreds of sensors at a glance
  • Use these insights to act promptly and optimize your system and maintenance intervals

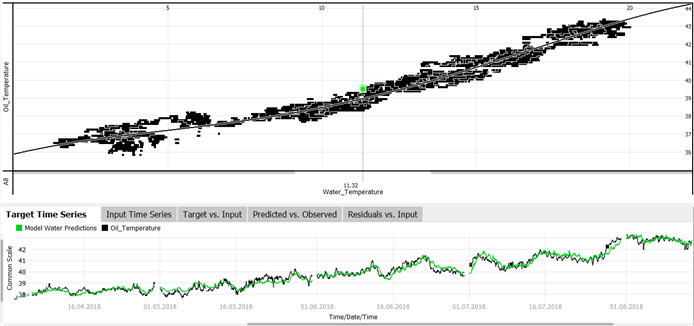
Use multivariate regression to model the expected behavior of your assets.
Click Image to enlarge

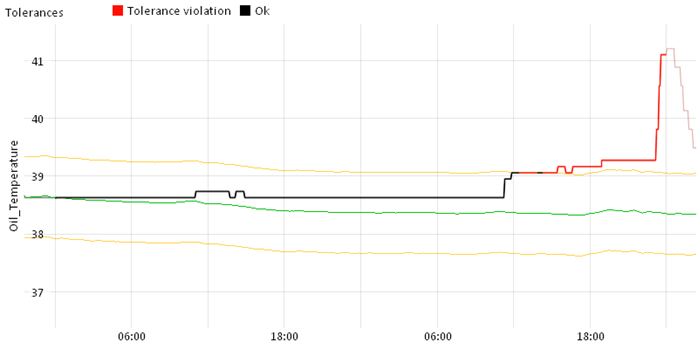
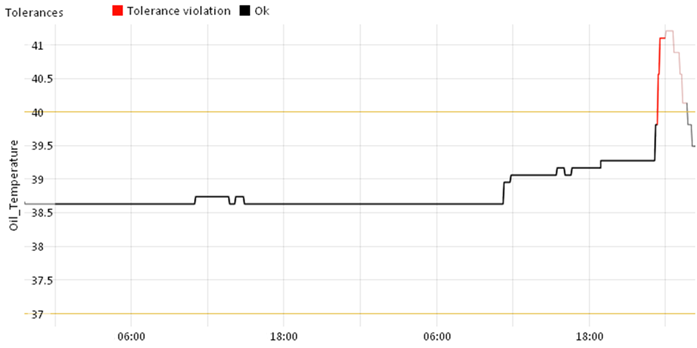
Static tolerances often need to be wide (left) while dynamic tolerances can be narrower without increasing the fault positive rate (right): Actual anomalies can thus be detected earlier.
Click Image to enlarge

If you want to learn more, or discuss an application for your individual data, feel free to book a live demo!

Modelling for condition-based monitoring

Condition-based monitoring (CBM) is a crucial aspect of predictive maintenance, enabling the detection of faults ahead of time and the optimization of maintenance schedules. The challenge lies in managing large, complex operating data that may be unsuitable for direct use due to outliers or abrupt changes. The expertise of the plant engineer is essential to interpret, correct, and annotate the raw data for these tasks.

The process from raw data to deriving a rule for early fault detection involves several steps. Initially, the data must be checked for plausibility, and suitable parts of the data must be identified for further processing. This allows for modeling plant behavior. A model “learns” the normal, desired state of the plant from the historical data, enabling to detect deviations from the expected state during operation. Further findings, such as wear processes between revisions, can be investigated and optimized during the modeling process.

Visplore supports the plant engineer in all these steps. With predefined views and tools, the plant expert can inspect and prepare raw data, model it, develop early warning rules based on actual data. 

Why our customers
prefer Visplore

Perfect for dirty sensor data. With Visplore, we give customers more insights for the same money.

When we need it fast, we use Visplore.

Visplore enabled us to gain significant new insights from massive data about the impact of production process parameters on product quality.

Thanks to its ease of use and high performance even with millions of measurements, Visplore has established itself as our standard tool for quality management in plants from China to South America.

Checking and cleaning data from energy systems used to be very time-consuming and kept us from our core tasks. With Visplore, data preparation has become much faster, and the quality of the resulting data has improved.

The good usability and the comprehensive visualizations enabled us to gain a deeper understanding of routinely collected data and their relationships. For example, this increased the quality of forecast models.

Visplore is recognised and in use as a central strategic software for data analytics throughout the company.

By analyzing process data from a large foundry with Visplore, complex dependencies were detected that we didn’t find with other software. As a result, our customer’s heat energy was reduced by around 5% and mold wear by around 4%.

For our thermodynamical simulations, Visplore helps us to identify suitable data, eliminate outliers, and analyze physical processes very effectively.

The visualization is fast and simple enough for live collaboration with the customers, on site. By this, Visplore supports a thorough understanding of correlations, outliers, and anomalies.

Visplore makes our analysis of sustainable energy systems much more efficient.
In addition to the performance for large data, its integration with scripting environments is a big plus.

Visplore allows for a much easier investigation of relevant patterns and structures. Our downstream analysis becomes more efficient and we gain more confidence in the results.

 
illwerkevkw

Detect faults as fast and easy as never before.