Cockpit: "Condition Overview"
Detect conditions such as anomalies, gaps, outliers, or repetitive values and get an overview of user-defined conditions, e.g., scripted ones. Inspect the distribution of such conditions and relate them across time series.
Pro This cockpit is only available in Visplore Professional.
Overview

This cockpit provides an overview of the distribution of conditions like data quality issues. Time series are organized hierarchically and sorted by problem frequency. Different views allow you to effectively capture the distribution of conditions with respect to time or categorical aspects, and to efficiently check them in detail in time series representations. With a single click, you can also select all time periods where all time series are free of any conditions like quality problems, to export this "clean" part of the data for further processing.
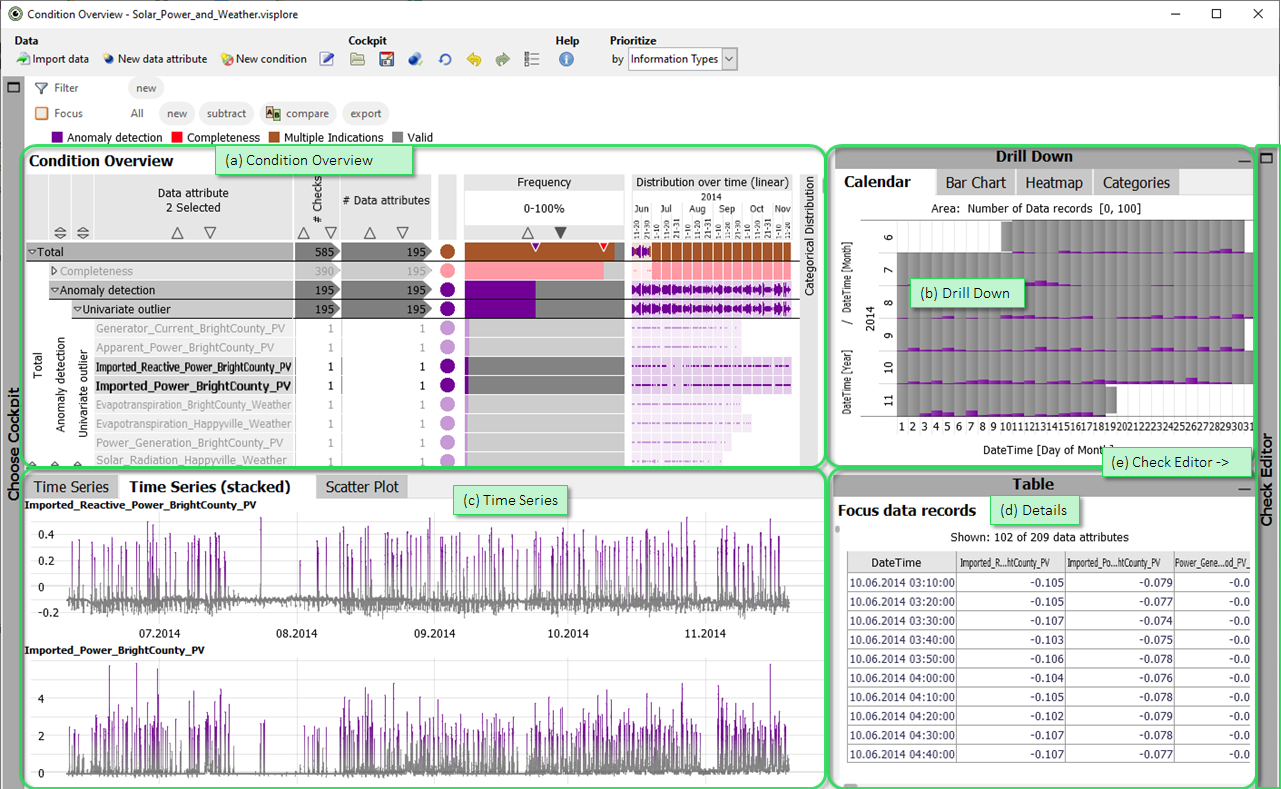
- Condition Overview: Hierarchical overview of condition "indications. Click the names of time series whose indications should be shown in detail in other views. Several expandable columns provide an overview of the distribution.
- Drill Down: The indication count of the currently selected time series is aggregated by time intervals or categories. Time ranges can be selected, which also limits the counting of indications in the "Condition Overview" to the selected ranges.
- Time Series: The selected time series are displayed here. Moreoever, the value distribution of the selected time series is shown as histogram, scatter plot, or parallel coordinates view, depending on the number of selected time series.
- Table: A table-like view of single values that can be shown on demand.
- Check Editor: Create new checks for conditions for the selected time series interactively, and adjust check parameters like thresholds.
Role Description - Starting the cockpit
The following roles can be given to data attibutes in this cockpit. Use the  icon in the toolbar to adjust them.
- Time axis: This role can be given to a data attribute defining a temporal ordering of the data records. Can be time stamps, or values. It will be used to define the temporal context for all variables, e.g. the times of measurement, consumption, production, etc. If the role is assigned to a data attribute of date/time type, periods like 'Month', 'Hour' etc. are extracted and available for defining filters, and categorical plots like bar charts.
- Variable: Numerical data attributes with this role are displayed in the cockpit, and the condition of their values being Missing is visualized.
- Category: Some views aggregate values by categories (e.g. per day of week, per month, etc.). When this role is assigned to a categorical data attribute, its categories are available for such aggregations. Example: Assigning this role to a 'Holiday' variable with categories 'yes' and 'no' allows comparing values like energy production for holidays vs. non-holidays. The role can also be assigned to numerical data attributes, which results in one category per distinct value of that attribute (e.g. different states encoded as 0 or 1). If the role is given to a data attribute of date/time type, periods like 'Month', 'Hour' etc. are extracted and available for defining filters, and categorical plots like bar charts.
- Upper limit: A numerical data attribute with this role defines an upper limit for another variable. It will be shown along with the referenced data attribute in time series views. For each violation of the upper limit threshold, the cockpit counts an indication that is included in the Condition Overview to allow rapid identification of such violations.
- Lower limit: analogous to Upper limit, but for lower limits.
- Setpoint: analogous to Upper limit, but numerical data attributes with this role represent a setpoint (=desired state) for the reference data attribute. Data attributes with this role are additionally displayed in time series representations, but do not result in condition indications such as for upper and lower limits.
- Checks: Assigning timeseries to the roles in "Checks" group allows to check for data quality issues in imported timeseries. For example, when assigning time series to the role "Univariate outlier", the cockpit checks for these anomalies for the assigned time series. The following checks are supported in the cockpit:
- Completeness
- Missing Periods: Marks periods where values are missing for a duration of at least a time span defined by the user in the cockpit (see Check editor).
- Anomaly detection
- Univariate outlier: Marks values that lie farther away from the mean/median than a number of standard deviations or interquartile ranges ('Tukey Test').
- Time series outlier: Marks values that are far off from the smoothed signal, i.e. local outliers regarding a certain time window.
- Leap in time series level: Detects strong changes in the smoothed signal, after applying a moving average smoothing.
- Sequence of identical values: Detects sequences where the same value occurs multiple times in succession.
- Duplicate Time Stamps: Marks time stamps that occur more than once.
- Time Gaps: Marks neighboring timestamps that lie further apart than a user-defined time interval.
- Structure
- Value change: Marks times where the signal changes.
- Time Series Trends: Checks for local time series trends based on moving averages.
- Completeness
Condition Overview
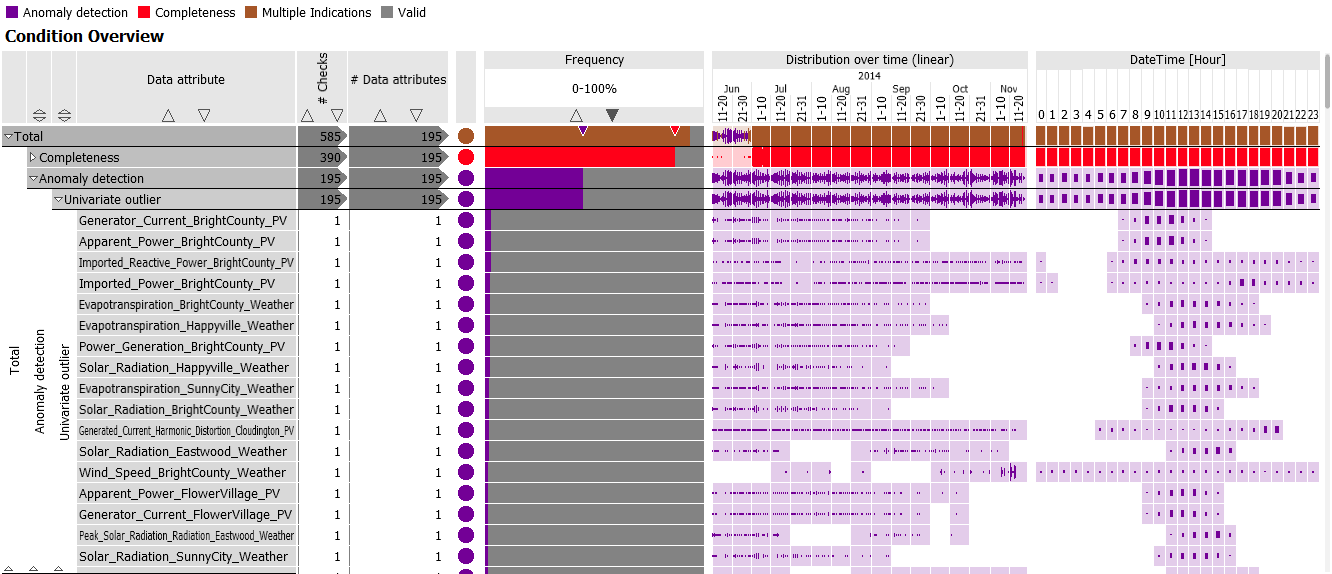
This view is the centerpiece of the cockpit, and provides a global overview of conditions like data quality issues for all time series. It is visually similar to a table: each row represents one time series or group of time series, and columns summarize the indications of these time series in different ways:

Rows: The rows in the Condition Overview correspond to a hierarchy of time series. Leaf nodes of the hierarchy always refer to individual time series, while higher-level nodes (e.g. the "Total" line in the image) combine multiple time series. By expanding hierarchy nodes, the user can choose any level of detail.
Columns:Columns in the Condition Overview visually summarize the indications of the time series per row in different ways. Examples are the proportion of time points affected by indications ("Frequency"), the distribution of indications over time ("Distribution over Time") or over categories ("Categorical Distribution").
Drill-Down

- Calendar: Shows the temporal distribution of indications for those time series that were selected in the Condition Overview by clicking on rows. Only those time series and information types that correspond to the row selection in the Condition Overview are taken into account.
- Bar Chart: Displays categories in the form of a bar chart, for example, one bar per hour, month, or day of the week. The bar length represents the number of time stamps that fall into a category. The categories for the bars can be selected via dropdown-menu when clicking the axis label.
- Heatmap: Displays combinations of categories similar to the calendar display. The size of the cells is proportional to the number of timestamps that fall into the corresponding category combination. The categories used for building the chart can be selected via dropdown-menu when clicking the axis labels.
- Categories: Similar to 'Heatmap', for up to four categorical attributes at once.
The views can be used to perform selections of categories by clicking the category labels, which defines a focus for the other views. If a focus was already defined in other views, the Drill-Down views only consider the data records of the Focus.
Time Series

Note: As long as no time series selection has been made in the Condition Overview, these views are not displayed.
The Time Series and Time Series (stacked) views show time series that were selected in the Condition Overview by clicking on rows. The former distinguishes the selected time series by color, the latter highlights the indications selected in the overview using colors. This can be used for a detailed examination of the indications in the context of the time series values.
Time Series (stacked) shows up to five selected time series next to each other. If more than five time series have been selected, the five time series with the most indications are displayed.
Both time series view types offer several options when clicking the view titles. The most important ones are:
 Selection mode: Can be found when clicking the orange rectangle symbol after clicking the view title. Availble alternatives are 2D rectangle, 1D intervals, and a free-form Lasso selection.
 Automatic zooming: enabling this feature will let the time series zoom automatically to the focus, whenever a new focus is defined.
Histogram, Scatter Plot, Parallel Coordinates: One of these is shown at a time, depending on the number of time series selected in the Condition Overview - visualizing the value distribution of the selected time series.
Check Editor
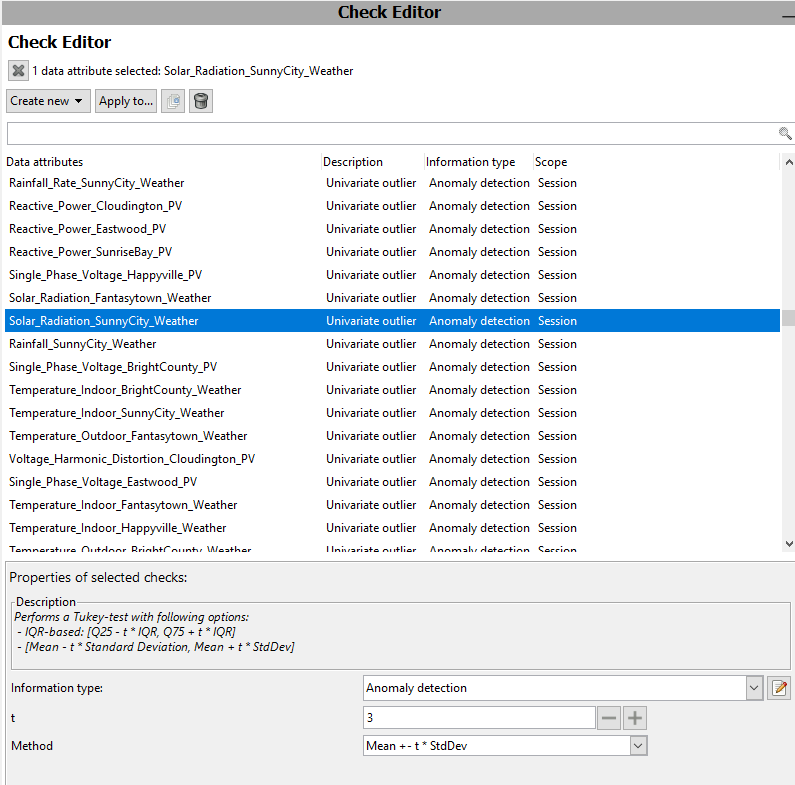
Provides a user interface to create new checks for conditions, for the currently selected time series. Time series to create checks for can either be selected in the Condition Overview, or in the Check Editor, via a click. Selecting multiple time series at once allows to create checks for all of them at once. Selecting multiple checks of the same type allows to change their parameters at once.
 |
X: The x icon below the view title "Check Editor" clears the selection of time series. This is useful to see all checks for all time series again in the list. The list can also be filtered by typing text parts in the search bar above the list. Create new: create new checks for the selected time series. Depending on the choice of check type, default parameters are chosen that can be changed below in the "Properties of the selected checks" pane. Apply to: After selecting an existing check, this button lets you apply the same check to one or more other time series. Clone, Delete: use the icon buttons next to "Apply to" to clone a check (e.g. multiple different thresholds) or to delete it. Properties of the selected checks: various check types have parameters. In this pane at the bottom of the interface, you can change parameters of the selected checks. |
License Statement for the Photovoltaic and Weather dataset used for Screenshots:
"Contains public sector information licensed under the Open Government Licence v3.0."
Source of Dataset (in its original form): https://data.london.gov.uk/dataset/photovoltaic--pv--solar-panel-energy-generation-data
License: UK Open Government Licence OGL 3: http://www.nationalarchives.gov.uk/doc/open-government-licence/version/3/
Dataset was modified (e.g. columns renamed) for easier communication of Visplore USPs.
