OSIsoft PI Data Import
Pro This data connector is only available in Visplore Professional.
Visplore can directly connect to OSIsoft PI servers and import data from there (tags, attributes, assets, ...). As an official OSIsoft partner, Visplore adds value to your PI system in various ways, as shown in this video: https://visplore.com/partnering-with-osisoft/.
Typical use cases with PI data are:
- regular inspection of the newest data from PI ("Monitoring with deep dive")
- deep dive in case of process problems, such as root-cause analysis
- analyzing process stability, e.g. if the process behaved the same whenever "Product X" was manufactured
- comparing time periods to each other with one click
- interactive analysis of long periods of historical data, e.g. trends, correlations, etc.
- analyzing large numbers of tags, including overviews of correlation and predictive analytics
- extracting batches from raw time series using pattern searching and other segmentations
- automating analyses or the labeling of PI data
- or just using Visplore as a neat way of accessing PI data and exporting it (manually, or automatically via Python)
Requirements and setup
Visplore connects to a PI server using the PI Web API.
Requirements for the PI Server:
- PI Data Archive 3.4.380 or later is required; PI Data Archive 2012 or later is recommended
- PI Web API version 2017 R2 or later is required. Note that “Kerberos”, “NTLM”, and “Basic” authentications are supported
Optional ways of accessing data from PI Server:
- PI AF Server 2018 (v2.10.0) or later is required for importing tags via PI Asset Framework
- PI Indexed Search Crawler is necessary for tag searches in PI Web API 2021 SP 2 and earlier. However, starting from PI Web API 2021 SP3 and later versions, tag searches without the search crawler are supported
Visplore needs a config file to know where the PI server is located and other details for connecting. Please ask your contact person at Visplore GmbH for that config file. They will set it up for you, and will need these three bits of information from your PI admin:
- The host name of the PI Web API. Specifically, the full endpoint name with the used protocol, for example: https://www.server.my/piwebapi
- The port, in case of a dedicated port being used. If not, Visplore uses the defaults: 80 for http, and 443 for https
- The authentication method. Visplore supports “Kerberos”, “NTLM”, and “Basic”.
- 3.a. In case of Kerberos, please also provide the SPN (e.g. "HTTP/local.domain"). More info on the SPN can be found
(https://learn.microsoft.com/en-us/windows/win32/ad/name-formats-for-unique-spns)
Note: The "Host" part of the SPN should refer to the machine that's verifying the Kerberos authentication, which may be a different one than the machine running the PI Web API and other PI services
Finally, the config file needs to be put in the right location. Visplore supports 3 different locations, as described in this documentation.
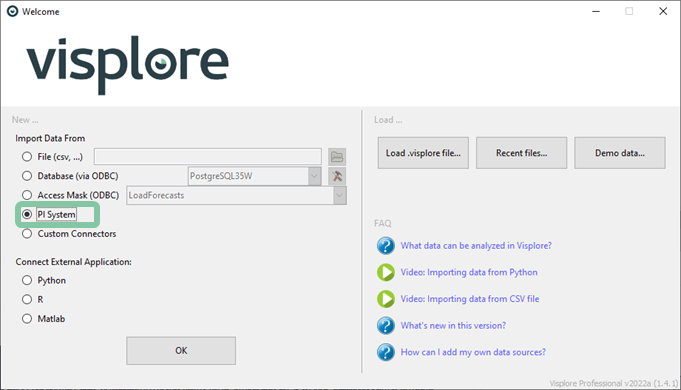
Once the file is in place, and you restart Visplore, there should be a new option in the welcome dialog. In case there are multiple connections defined in "HistorianSources", you will be asked which one to use.
Overview: Importing data from PI
Visplore always imports data from PI in the form of one data table, with values taken at a common time resolution. Tags are the table columns, timestamps are the table rows. All tags are sampled at the same timestamps. These timestamps can either be a regular raster (e.g. sampled in 1-minute resolution), or the raw events of one particular tag (e.g. whenever a specific tag changes value). It's currently not possible to load the raw events for each tag separately. But the benefit of a common sampling is that you can do correlation analysis, scatter plots, regression and other analyses of values observed at the same time.

As an overview, importing and analyzing data from PI follows these steps:
- Perform initial import.
- Select "PI System" in the welcome dialog.
- Type user credentials (often, these are the same as your Windows credentials).
- Select tags via tag search or Asset Framework (see sections below).
- Specify the time period and resolution for import.
- Optionally save your import configuration for later use.
- Perform the import.
- Use Visplore's cockpits to analyze the data.
- For example, plotting, pattern searching, comparing time periods, etc.
- Optionally save a Visplore file to share the analysis and revisit it later for new data.
- Add new tags or adjust the time period at any point, and continue analyzing.
- Export data tables for use in other tools, export images for reports, save Visplore stories for presentation, etc.
The following sections describe these steps in more detail.
Note: PI import means, data is fetched for a desired time period and desired set of tags from the PI server. Then, the imported data is available in Visplore (in RAM) without extra data fetching, and be analyzed at high performance. Users can add tags or change time periods later, but this is triggered explicitly by the user. Visplore does not incur a constant load on the PI server.
PI Import dialog
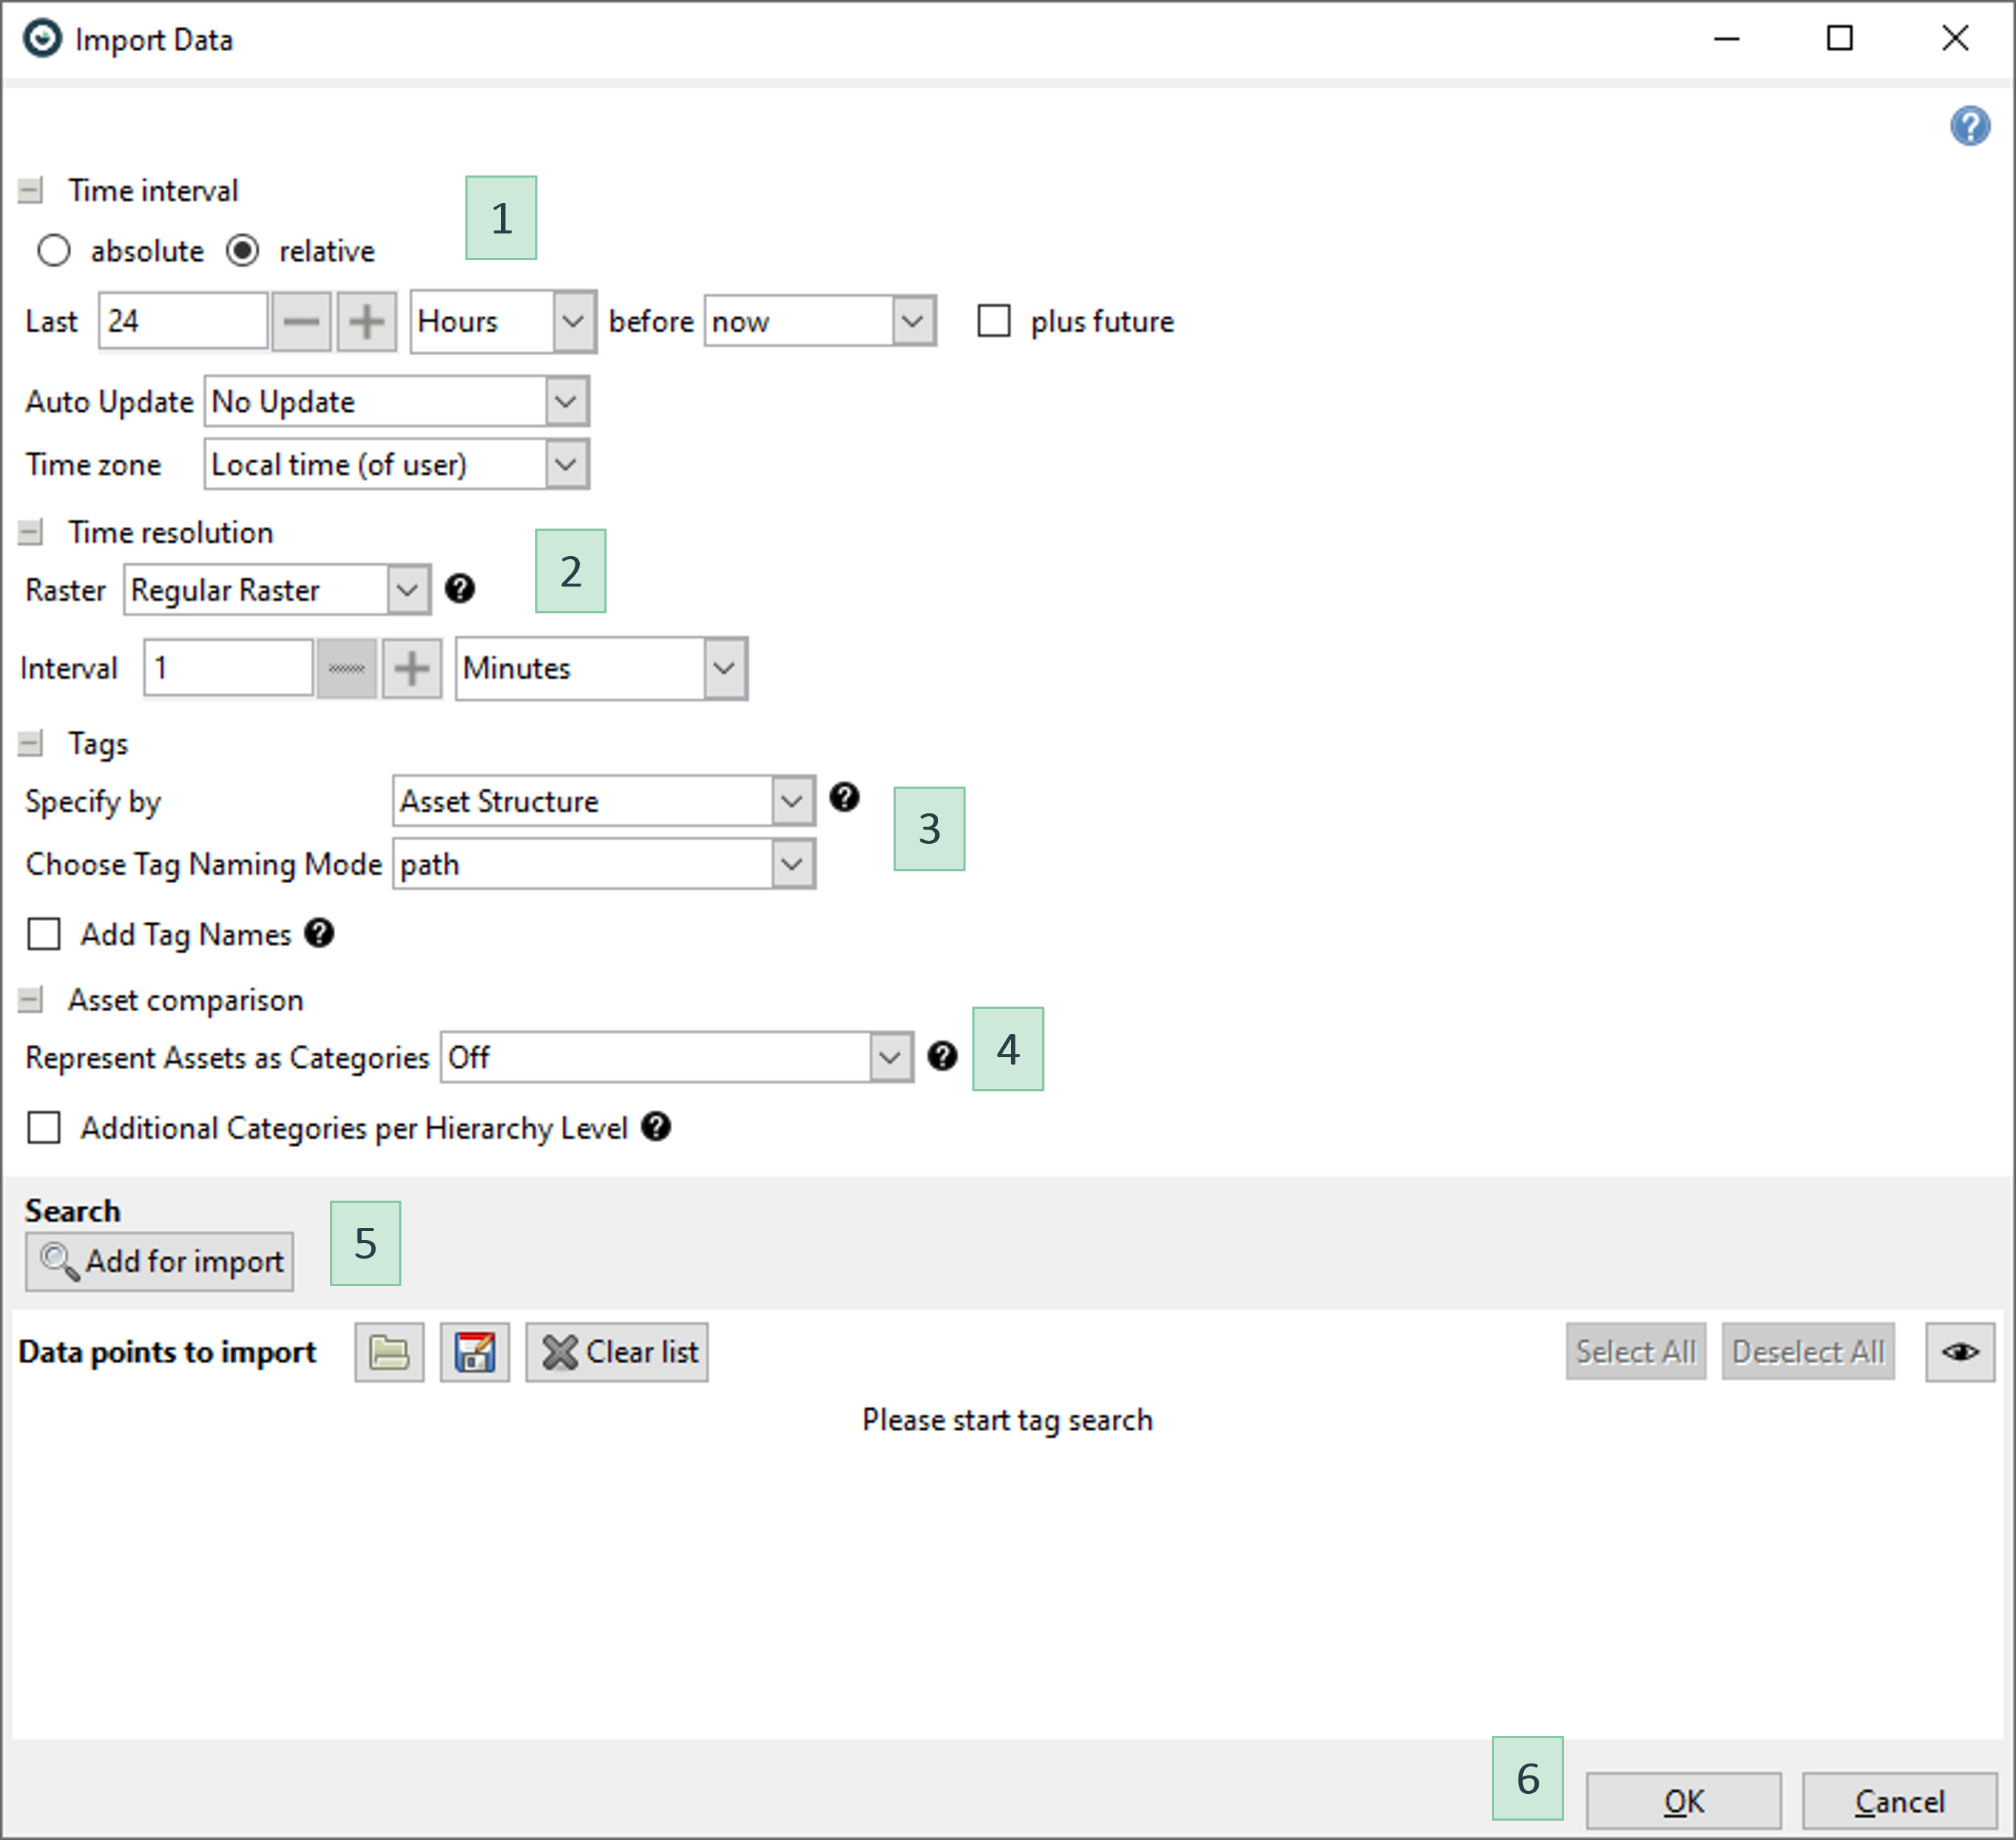
Once you have chosen "PI System" in the welcome dialog and have pressed OK, the following import dialog is shown:
In the import dialog you can follow the below workflow:
1. Specify the time interval. 2. Specify temporal resolution. 3. Specify the column structure (how are tags named). 4. Specify asset comparison preference (Only available for Asset Framework) 5. Specify tags to load. 6. When you're done, press OK to confirm the import. A Visplore cockpit will start. You can confirm the "Role assignment dialog" by pressing OK. Then you should see some visualizations and can start analyzing the data. |
 |
The next sections provide more details on the possibilities for specifying which tags to load during import.
Select tags by "tag search" (by name)
Prerequisite: the PI search crawler service must be running, see the setup section above.
When searching tags by name (if set in the "Column Structure" at the import dialog), the following dialog is shown after you click "Add for import":
|
1. You can specify which attribute to search in (e.g. name, tag type, description, etc.). 2. Add additional clauses with the "+" sign, and remove them with the "-" sign. 3. If "All Conditions are complied" is selected, then all of the conditions [1] must be met by the results. |
 |
Note: if you use "Contains", you don't need to type asterisks '*' before or after the search string. A blank between two word parts is interpreted as an "AND" operator.
Troubleshooting, if your tags can't be found: see the Troubleshooting section at the bottom of the page.
Select tags from PI Asset Framework (PI AF)
To load data from PI Asset Framework switch the column structure method to "By Asset Structure" at the import dialog, then click "Add for import".
In the following dialog, select the tags by navigating the hierarchy of the asset framework.
|
1. Make sure the right asset database is set on top. 2. Navigate the hierarchy and select the assets on the left with the checkmarks that you want to import tags from. 3. Then the right side shows all tags and data points that are *directly* connected to that selected AF node on the left side. If you want to access tags that are in subnodes, you have to select the subnodes on the left. |
 |
Important:
- You can select multiple similar assets on the left side, then load the same tags for all assets at once (like in the image above).
- If you want to compose tag lists containing tags from multiple assets, don't try to select them all at once. Mixing tags from different assets may be difficult/confusing with the checkmarks on the left side. Instead, you can open this dialog more than once, adding tag groups from compatible assets one at a time.
Troubleshooting, if your tags can't be found: see the Troubleshooting section at the bottom of the page.
Saving and loading tag lists
After you have composed a list you would like to import, it is possible to save the list for later uses which is especially helpful when working with longer tag lists because you don't have to repeat the whole selection process of the tags again.

By clicking on the save button above the list in the "Import Data" dialog, the current tag list can be saved as a file without extension. This file can be loaded into another Visplore session with the load button.
Important:
- You can't load .visplore files here at the moment, only explicit tag list files.
- Loading a tag list just adds the contained tags to the current list you already have composed. You can use the "Clear list" button to clear the list first or you can use the "Remove selected" button to remove the selected tags from the list.
Within the PI dialogs which show a tag list, you can press "CTRL + C" to save the tags to the clipboard and paste that list (full tag paths) into another program like a text editor. In the same way, you can press "CTRL + V" in Visplore to paste any full path of a tag into the tag list. This is super-useful if you already have the full path in another tool (e.g. in PI System management tools, Processbook, etc.).

Also note: it's possible to load tag list files exported from PI Vision as well, see the next section.
Load tag lists from PI Vision
From PI Vision, it's possible to export the data of a display as a CSV file. Visplore can read the tag list from such a CSV file through the import tag list functionality described in the previous section. This is a fast way of looking at the same tags in Visplore that you just had in PI Vision.
How to export CSVs from PI Vision is described here: https://docs.osisoft.com/en-US/bundle/pi-vision/page/export-data-from-a-display.html
Note: Visplore currently only imports the tag list. In future versions, it may also read in the time period from the CSV, in order to produce the same graph as you just had in PI Vision.
Setting up operational dashboards on live data
PI System usually contains fresh and up-to-date live data. Visplore allows to create analysis dashboards that work with this latest data. These dashboards can be used easily to monitor the latest production or quality data without any further setup effort. Furthermore, these dashboards can be shared among multiple users. Setup an operational dashboard on live data as follows:
Import your data using the PI System as described in the above sections. To see the latest data, you may want to use a relative time interval (e.g. "last 24 hours" or "last 7 days").
Configure your visualizations as needed.
Save your analysis as a .visplore file by clicking  . Use the checkbox "Keep link to data source" when saving your analysis, as seen below. See the chapter Saving and loading the analysis for details.
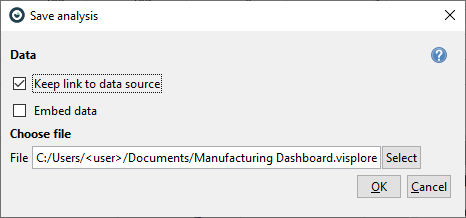
Optionally, share this file with other users. Loading such an analysis (either by double-clicking on the .visplore file or through the welcome dialog) allows you to load the most recent data from now or the most recent data from when the file was saved.
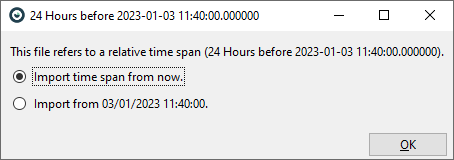
Note: When sharing a .visplore file with other users, they need to have the PI System configured in Visplore, too.
When your database schema changes, it usually results in a different data table. In this case, it might happen that out-of-date .visplore files throw a warning or do not load at all. In this case, you can try to import your data through the PI Import dialog first, and then apply the old .visplore file and select "apply to current data" when asked. Now save your analysis with a new file name, again with the "Keep link to data source" option.
Now you can perform routine analysis on your live data on a regular basis, thus operationalizing your analysis.
If you have questions about this, please get in touch with us via Questions and Feedback. We are happy to provide you with details!
Adding tags later on
You can add tags to your analysis even after you have imported the data into Visplore.
Click on "New data attribute" in the top toolbar of Visplore and select "Add tags from PI".
Click on "Add for import" and select the new tags you would like to import.

Note: if the initial import method was via tag search / Asset Framework, adding tags later on will only be possible through the same method.
Note: the "Data points to import" dialog, where you see the list of imported tags, also allows you to look up the list of imported tags later on, during the analysis. You can even export the list by pressing "CTRL + C" while in this dialog, and then paste it from the clipboard into another tool (e.g. Notepad). In the same way, you can press "CTRL + V" to paste a list of full tag paths into this dialog, coming from another tool.
Changing the time interval later on
Press the little blue PI icon in the top toolbar of Visplore.

There, you can adjust the time period later on, which triggers a re-import from the PI server, but keeps all of the analysis as it just was. This is very important for applying an analysis to the newest data later on. E.g. loading a Visplore file with an analysis, then applying it to a new time interval using this feature.
When using relative time intervals, it's also possible to set an auto-update interval here, e.g. every 1 minute or every 10 minutes. This is useful for setting up a screen that always shows the newest data.
Frequently asked questions
Where can I see / export the list of imported tags later on?
- In the "Add tags from PI" dialog, see the section "Adding tags later on" above.
- You can also export the list from that dialog by pressing "CTRL + C".
Can I import multiple time periods at once?
- Yes, you can clone the data source in the Data Source Manager. Then, you can change the time interval for the cloned source.
Can I import PI event frames?
- Not yet, but this is planned for future versions.
Can I set up a live screen that always shows the newest PI data?
- Yes, you can set up a refresh rate (e.g. every 1 minute). See the "auto-update" feature described in the section "Changing the time interval later on" above.
Can I fully automate the analysis?
- Yes, this is possible through Visplore's Python API. You can set up a Python script, running once a day, that uses Visplore functionality through our API. There are API commands for starting Visplore, loading a .visplore file [load_session] that pulls the newest data from PI, performs an analysis (e.g. Pattern search), and retrieves results like data tables, images, labels, PDFs, etc. from Visplore. That way, you're using Visplore's PI importer as a convenient way to access the newest PI data from Python, and to perform some analysis or data preparation. With the received data, you can store information such as labels back to PI from Python, or send an alert email to a colleague.
Does Visplore incur a constant load on the PI server?
- No. PI import means, data is fetched for a desired time period and desired set of tags from the PI server. Then, the imported data is available in Visplore (in RAM) without extra data fetching, and be analyzed at high performance. Users can add tags or change time periods later, but this is triggered explicitly by the user.
- The only exception is when setting up a live monitor that automatically updates data from PI in a regular interval. Then, data fetches are performed in that interval.
Where do the credentials for the PI connection come from? Can I use credentials from active directory?
- Visplore supports "Basic" and "Kerberos" authentication. The user is prompted to type the credentials when connecting (single sign-on is currently not supported). It is possible to store the credentials for some time after typing them, to avoid having to type them every time.
Troubleshooting
Establishing the initial connection:
- If you receive the following error message: "PI System: no config files for establishing a connection found in folder HistorianSources."
- Please ensure that the only file extension of the config file is XML. It can happen that in Notepad or similar, you save the file unintentionally as a .txt file. If you leave the file filter on ".txt" when saving, this results in e.g. "PIconfing.xml.txt", and Visplore does not recognize it. If in doubt, configure Windows to display the file extensions.
- Visplore scans for PI System configurations on start only, so close and restart Visplore. Changes to the XML file also require the restart of Visplore.
- If you still can't establish a connection with your PI System, it can be that you have errors in your XML file, such as syntax errors like not closing an element, etc.
- In most cases, the "PI System: Not possible to connect to the Pi System. Request Interrupted." error message refers to these cases:
- The PI server is unavailable.
- The PI server name is misspelled in the config file.
- If you use wrong user credentials while connecting to your PI System you get the following error message: "PI System: Not possible to connect to the Pi System. Authentication Failed! Please try again."
Troubleshooting PI Tag Search:
- Error message "No search results found" -> either the searched attribute is misspelled or one of the reasons below.
- Error message "Search source has not yet been crawled" -> make sure the search crawler is running.
- If the search crawler IS running: ask your PI admin whether the search crawler database table is set up correctly.
- Make sure any involved security certificates are valid/up to date.
- In some cases, a restart of the crawler / web API service has helped.
- If you *just created* a tag, please note that the search crawler may not immediately find it. Use the "CTRL + C" functionality described in the "Saving and loading tag lists" section to access the tag via its full path, without searching.
If the assets you expect are not showing up when searching by Asset Framework:
- Make sure you have selected the right asset database on top.
- Make sure your user has the necessary rights for that asset database.
- Make sure the asset framework service is running on the PI server (ask your PI admin).

 . You can also load lists at this point with the folder button
  which adds them to your current list.