Cockpit: "Multivariate Regression"
Fit multivariate polynomial regression models for analyzing sensitivity and dependencies on multiple variables.
Pro This cockpit is only available in Visplore Professional.
Overview
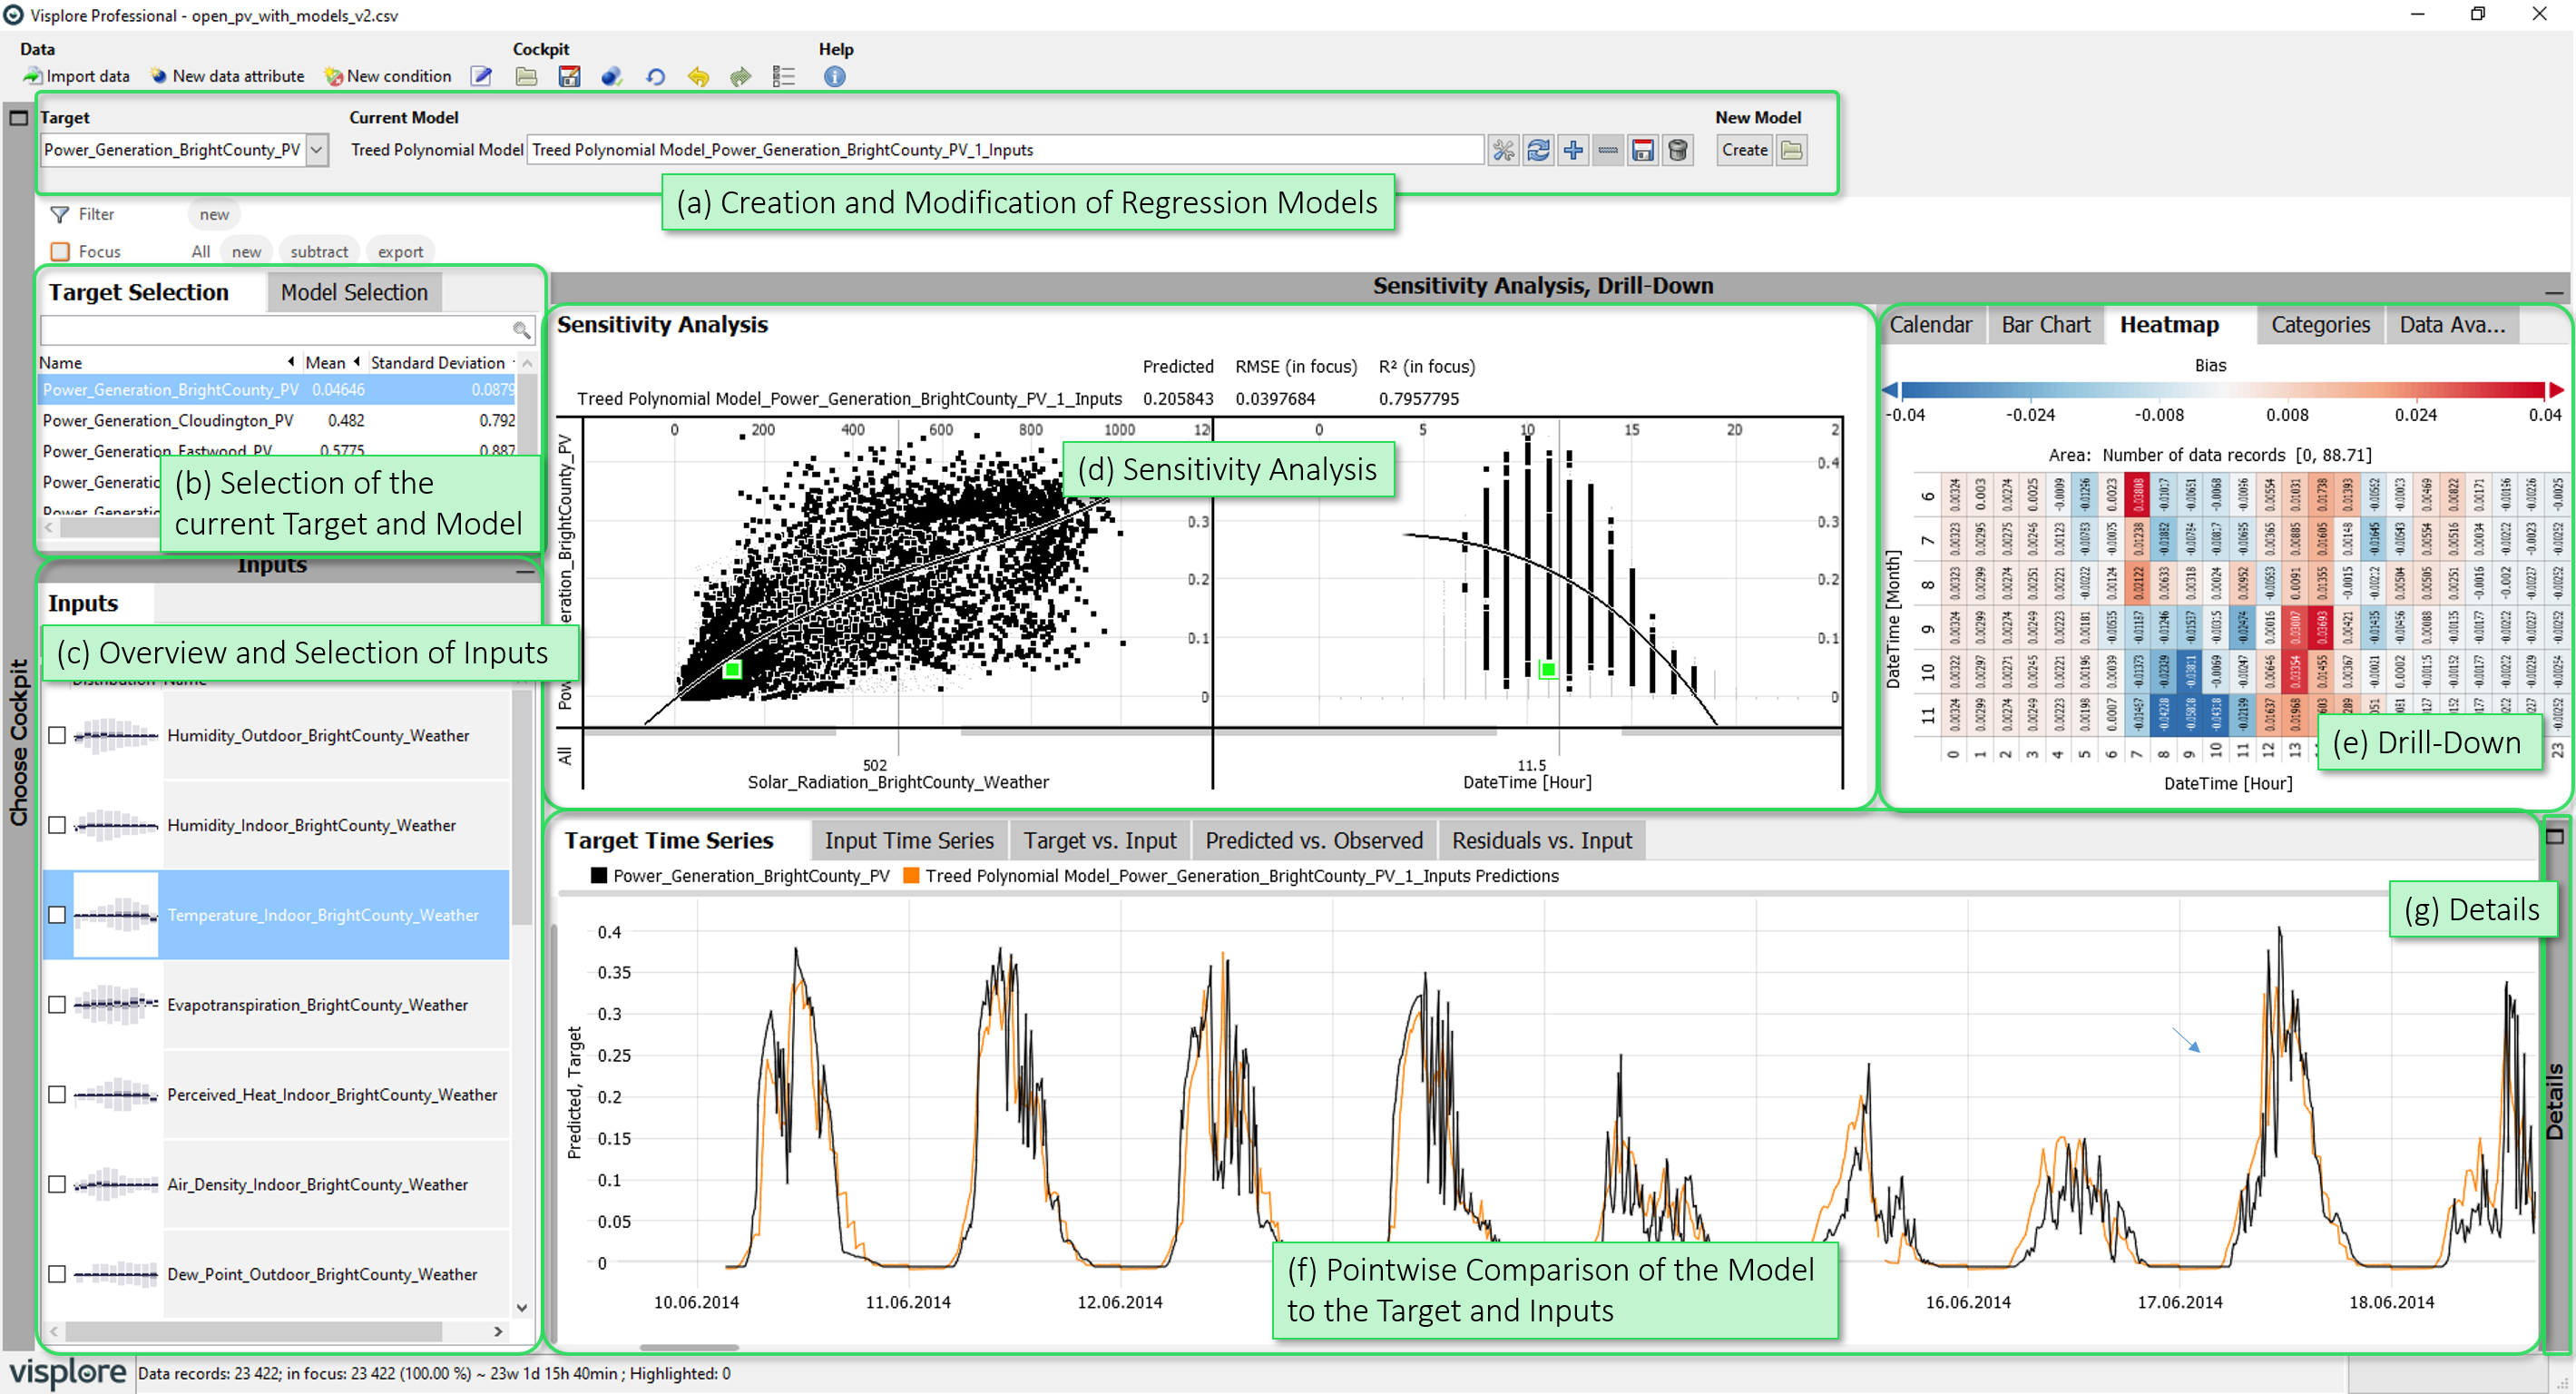
- Creation and Modification of Regression Models: This area provides control elements to choose a target variable, to create and configure regression models, and to save and load them to/from a file.
- Selection of the current Target and Model: Allows to select the current target variable, as well as the current regression model (if multiple models have been created).
- Overview and Selection of Inputs: Ranks the input variables by their relevance for the current target (or model residuals, after a model was built), and allows to select inputs to be included in the regression model.
- Sensitivity Analysis: Shows the sensitivity of the current model on its input parameters.
- Drill-Down: These diagrams show error measures of the current regression model (e.g. bias, rmse, mape), drilled-down by categories.
- Pointwise Comparison of the Model to the Target and Inputs: The diagrams in this group provide a pointwise comparison of predicted values for a regression model to the target and input values (e.g. using a timeline).
- Details: The "Function Information Overview" shows the inputs and terms of the current regression model, while the table "Focus data records"" allows to access the exact values of the involved variables and predictions.
Starting the cockpit - assigning semantic roles
The following roles can be given to data attibutes in this cockpit. Use the  icon in the toolbar to adjust them.
- Time axis: This role can be given to a data attribute defining a temporal ordering of the data records. Can be time stamps, or values. It will be used to define the temporal context for all variables, e.g. the times of measurement, consumption, production, etc. If the role is assigned to a data attribute of date/time type, periods like 'Month', 'Hour' etc. are extracted and available for defining filters, and categorical plots like bar charts.
- Target: Variables with this role are target variables whose dependency on independent variables is to be investigated. Example: A consumption or production time series to be modeled as a function of weather time series. There must be at least one variable for this role, but there can also be more than one.
- Independent Variable: Data attributes with this role are independent variables whose influence on target variables is to be investigated. Example: Weather time series that could be relevant for a consumption or production time series. Any number of numerical and categorical variables can have this role.
- Category: Some views aggregate values by categories (e.g. per day of week, per month, etc.). When this role is assigned to a categorical data attribute, its categories are available for such aggregations. Example: Assigning this role to a 'Holiday' variable with categories 'yes' and 'no' allows comparing values like energy production for holidays vs. non-holidays. The role can also be assigned to numerical data attributes, which results in one category per distinct value of that attribute (e.g. different states encoded as 0 or 1). If the role is given to a data attribute of date/time type, periods like 'Month', 'Hour' etc. are extracted and available for defining filters, and categorical plots like bar charts.
Getting Started: Creating Regression Models for Sensitivity Analysis
Based on the "Solar Power" demo dataset, this section explains how to create polynomial regression models and perform a sensitivity analysis in the cockpit. In the example, we build a regression model for 'Power_Generation_BrightCounty_PV' (role 'Target' upon starting the cockpit) using all variables containing 'weather' as candidate input features (role 'Independent Variable'). First, an interactive, manual feature selection workflow is described, followed by automatic feature selection as an alternative.
Manual Feature Selection
A typical first step is taking a look at univariate input features, to see if descriptive input variables exist, and the data quality is sufficient for modeling. Looking at the 'Inputs' diagram shows a list of all variables with the role 'Independent Variable', ordered by their relevance for modeling the currently selected target variable. Internally, this ordering is based on the R square metric of a univariate piece-wise constant fit per variable.
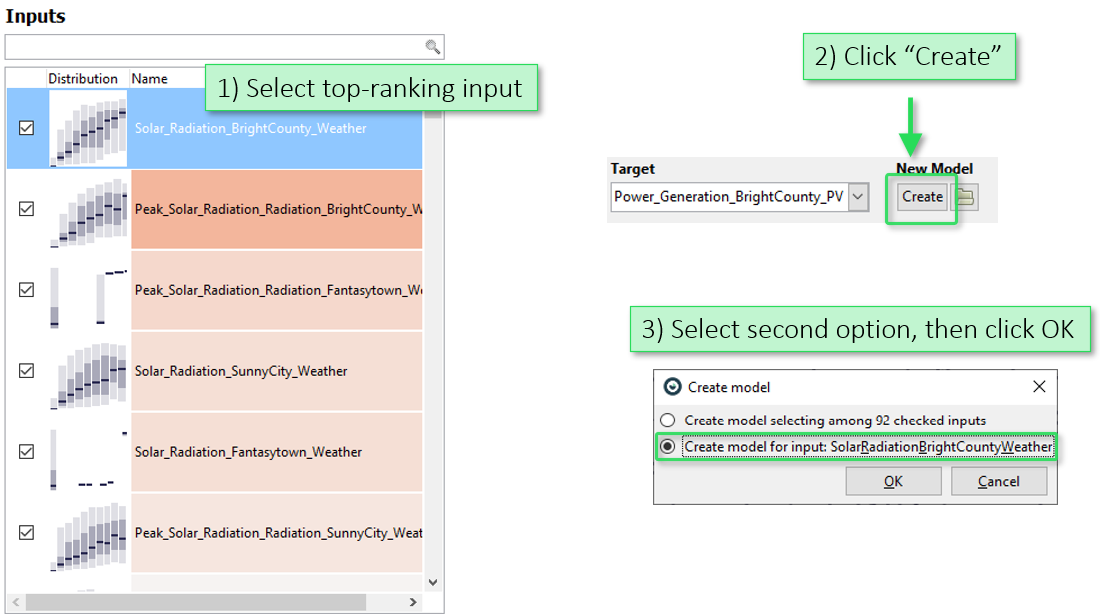
In the "Inputs" view, select the top ranking feature with a click, then press the "Create" button in the toolbar of the cockpit. In the dialog, select the second option to build a polynomial model based on the selected feature:
After training a model, there are several views to inspect it and validate the fit:
The "Sensitivity Analysis" shows the function graph of the model. The "Drill-Down" views like the Calendar show the model bias (systematic over- or underestimation) using colors. The "Predicted vs. Observed" view plots predictions and actual values, where an ideal fit would be points on the diagonal line. The "Function Information Overview" shows the model definition along with its coefficients":
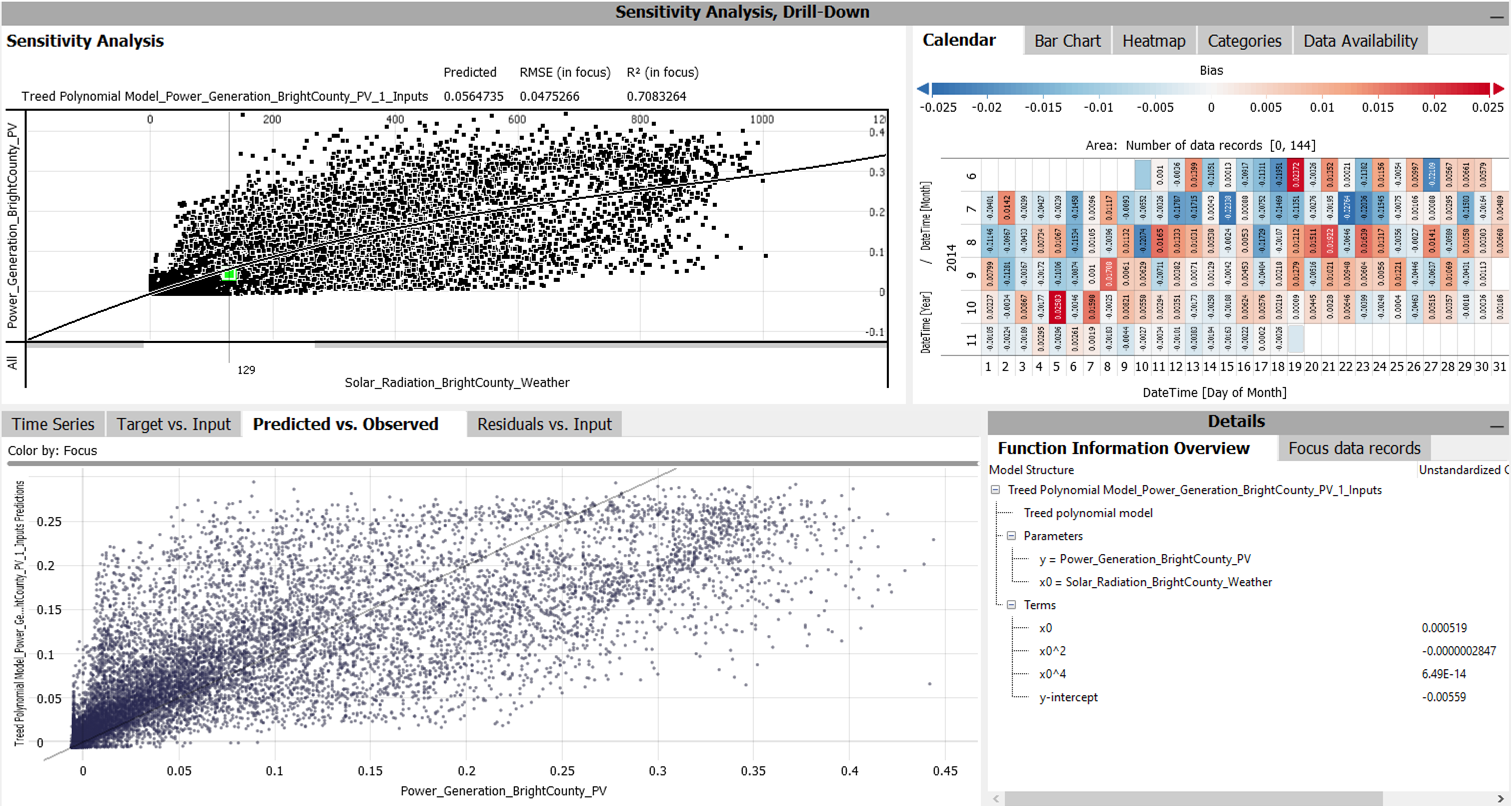
Also, the "Inputs" view has updated, and shows the distribution of the model residuals per variable (see image below). This indicates which variables may explain the reminaining variance in the target variable. In the image below, this would for example be a humidity-related feature.

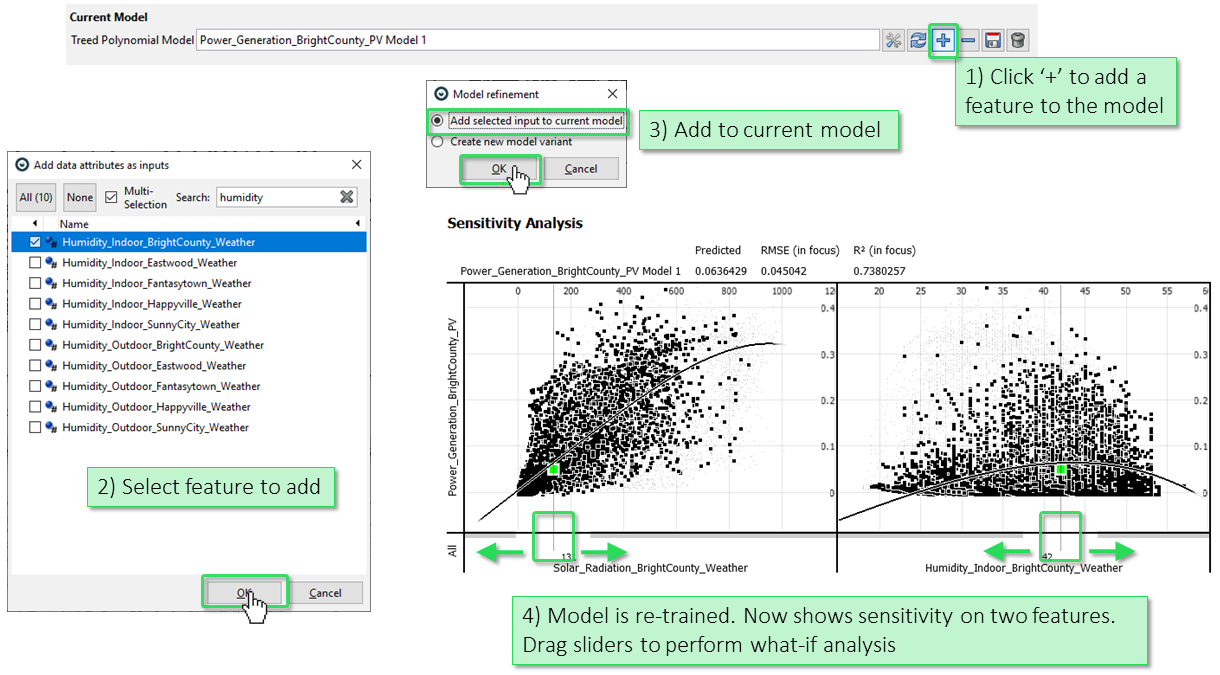
Press the "+" button in the toolbar to add a new feature to the model definition. In the pop-up window select the feature you would like to add and click "OK". You can either add this feature to the current model or create a new model. It is also possible to select multiple features. The model becomes two-dimensional. The "Sensitivity Analysis" view now shows slices of the two-dimensional model. Dragging around the vertical sliders supports a what-if analysis: say the solar radiation was 800, how would the predicted production depend on the humidity in that case, for example:
You can now continue with this step-wise model extension workflow to add / remove further selected features to/from the model. Use the "Configure current model" icon in the toolbar (leftmost icon showing a screwdriver and a wrench) to edit some parameters of the model, e.g., which data subset is used for training and validation. By default, models are trained on all data records after Filters you may have defined.
Automated Feature Selection
As a second model building approach, the cockpit supports an automatic forward selection algorithm. In this case, features are added to the model based on a correlation measure, until no significant improvement is gained anymore. Users can still interact with the model creation process, by (1) selecting a subset of features to choose from, (2) adding (univariate or interaction-) terms to the model definition that MUST be included, and (3) setting the parameters for the automatic selection approach, like a termination criterion.
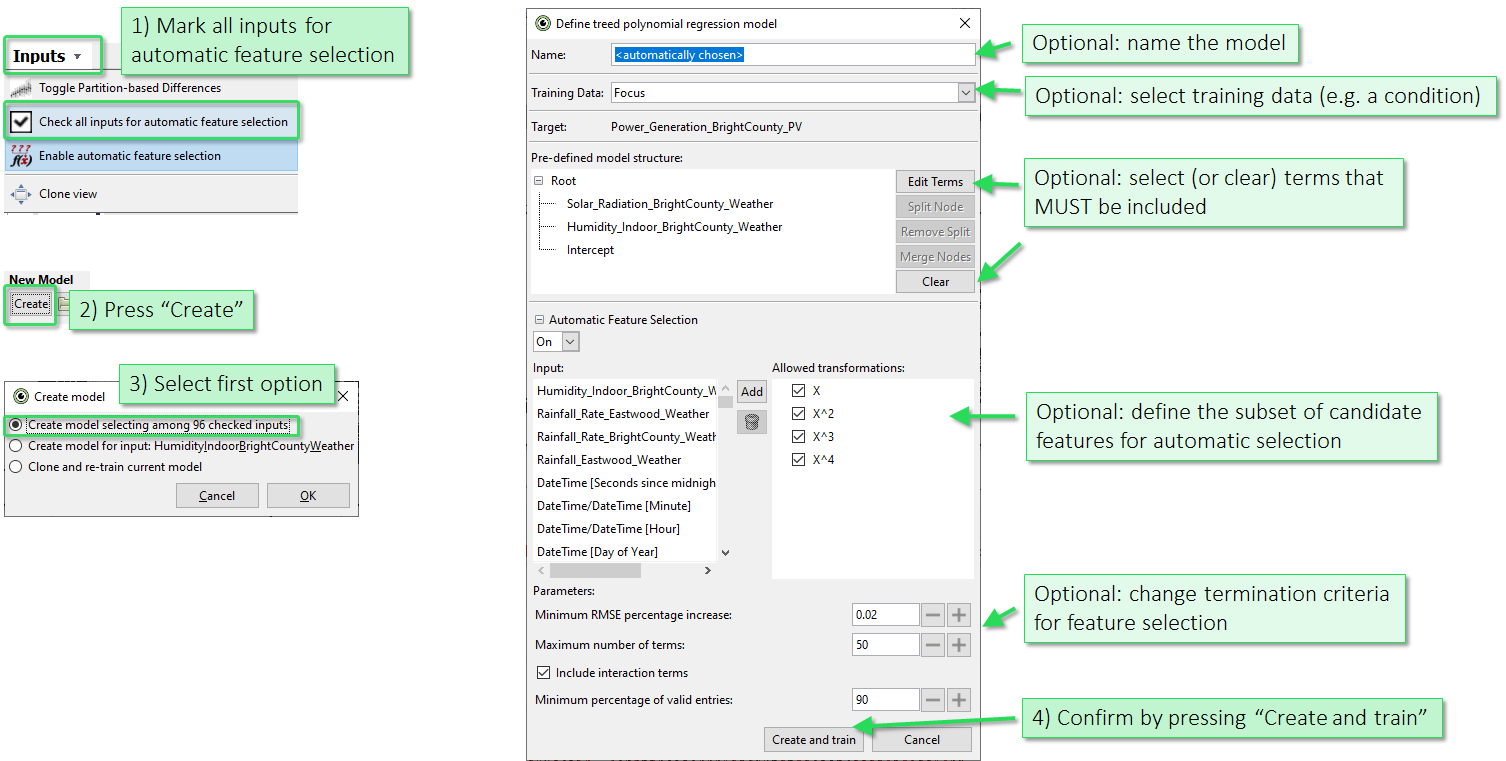
Click the view title "Inputs", then "Check all inputs for automatic feature selection". Then, press the "Create" button in the toolbar and select the first option in the following dialog.
In the model creation dialog (see image below, right) you can either press "Create and train" to build the model right away using automatic selection, or you can modify parameters of the model building as shown in the image:
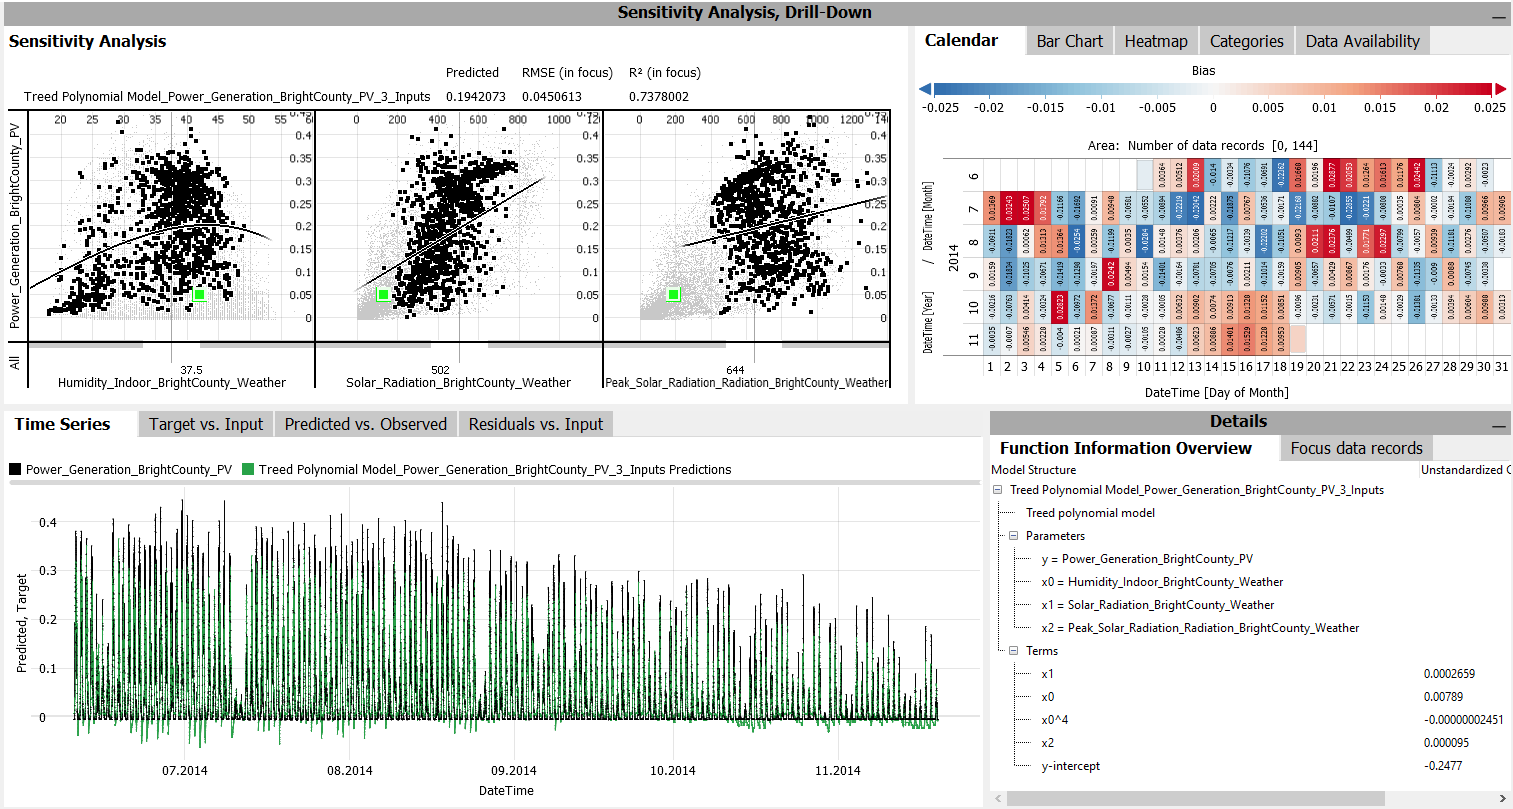
The resulting model has more than two inputs, as shown in the image below. The "Sensitivity Analysis" view now supports analyzing the dependency on each feature by assuming all other features as constant, as indicated by the draggable vertical sliders.
License Statement for the Photovoltaic and Weather dataset used for Screenshots:
"Contains public sector information licensed under the Open Government Licence v3.0."
Source of Dataset (in its original form): https://data.london.gov.uk/dataset/photovoltaic--pv--solar-panel-energy-generation-data
License: UK Open Government Licence OGL 3: http://www.nationalarchives.gov.uk/doc/open-government-licence/version/3/
Dataset was modified (e.g. columns renamed) for easier communication of Visplore USPs.
