What types of data are suitable for Visplore?
Visplore is optimized for data from time-dependent measurements. For any data, following time interpretations are offered: continuos, discrete or events with durations. Typical examples that are suitable for analysis in Visplore include, but are not limited to:
- Sensor data from machinery (e.g. industrial processes)
- Time series of energy production / consumption
- Meteorological time series
- Price time series
- Product quality samples
- Scientific experiments
- Incidents such as alerts
Data model
Since Visplore v1.5.x (v2023a), it is possible to merge data sources directly within Visplore. This could be done in two ways: wide or long. The alignment of the data sources is temporal, i.e. sources to be merged are aligned using respective time stamps. Mismatching or irregular temporal resolutions are handled by rasterization. Above explained data model is preserved after merges/transformations. Please refer to the [Working with multiple data sources] (https://visplore.com/documentation/v2023a/gettingstarted/working_with_multiple_data_sources.html) chapter for more information on merging data sources.”
Rows of this data table represent data records. Each data record has the same structure, like a set of conducted measurements (as columns, see below). They are often characterized by a point in time (e.g. the "time stamp") or other key information for unique identification.
Columns of the data table are the data attributes, given for each row. For instance, the physical quantities measured by different sensors at each point in time (see example below). Data attributes may be:
- Quantitative (e.g., measured value)
- Categorical (e.g., "on/off", different product types, "ok/not ok", error types, etc.)
- Time stamps
Examples
See this use case tutorial on how to work with tables in long format.
Example 1: Meteorological time series - with equal step size of 10 min

Example 2: Log of alerts - irregular time stamps

Example 3: Dataset of 4 wind turbines in long format - the same time stamp occurs in many rows

Example 4: Dataset of multiple assets and variables in long format – Single column holding all different variables

Please refer to the Video Academy: Reshape or merge data for further information on how to get such data into shape.
Example 5: Dataset with events with durations – ‘From’ and ‘To’ time stamps per data record

This type of data can be merged with continuous or discrete data through rasterization. Please see Use Case Tutroial: Correlating Process Data, Quality samples and ERP data for how.
Further aspects
Visplore supports missing values. It is thus ok if some data attributes are not specified for several records.
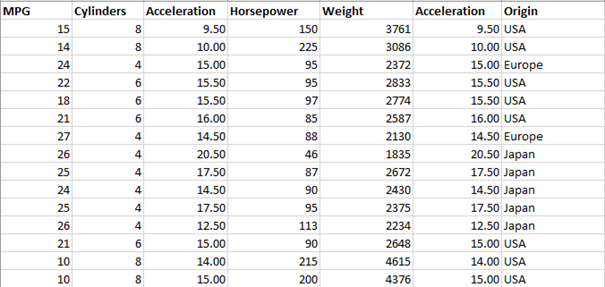
Furthermore, Visplore is not limited to time-oriented data. It is ok to load data that does not have any time stamps! Visplore can thus be used to, for example, analyze large sets of objects such as products, artefacts, etc. Such data could look like the following example of cars:

CSV files
For loading data from CSV files, some additional aspects need to be considered:
- The names of the data attributes are supposed to be represented as a single line. This is often the first line of the file, but Visplore also supports skipping lines before the line containing the attribute names. It is currently not possible to compose names of data attributes by combining multiple lines.
- Units may optionally be specified in the line beneath the attribute names.
- All subsequent lines are assumed to contain the actual data.
- Visplore tries to guess the data types for each data attribute. In some cases, however, data attributes with categorical semantics contain values and are thus assumed as value-typed. In such cases, it makes sense to manually switch the data type of the data attribute to "categorical".
- Visplore tries to recognize special characters from the data, in particular the characters used for (1) separating the data columns, (2) the decimal comma, and (3) digit grouping, if any. In some ambiguous cases, however, it can be necessary to manually override the assumed characters for correct import. It is required that these characters are used consistently throughout the file.
In Example 3, the ENGIE La Haute Borne windfarm dataset is used for the screenshot.
Source of Dataset (in its original form): https://opendata-renewables.engie.com/
License: Open License version 2.0 published by Etalab: https://www.etalab.gouv.fr/wp-content/uploads/2018/11/open-licence.pdf
